If you have ever opened your X analytics dashboard and felt like you needed a translator, you are not alone. Between impressions, reach, engagement rate, profile visits, and a dozen other terms that sound similar, it is easy to ignore the data entirely. That is exactly how useful growth signals get missed.
This glossary explains the metrics you will encounter in X’s native analytics and in third-party tools such as Xholic’s X Profile Analytics. You will learn what each metric measures, the formula behind it where one exists, realistic benchmarks by account size, and what to do when a number moves. For the strategic picture of how these metrics work together, start with our complete Twitter analytics guide. Keep this glossary open as the reference while you work.

Watch: How to Open and Read X Analytics
This current walkthrough shows where to find X analytics and how to review post and account performance. Use it with the definitions below so you can connect each dashboard number to the decision it should inform.
1. Reach and Visibility Metrics
These metrics answer one question: how many people actually saw your content?
Impressions
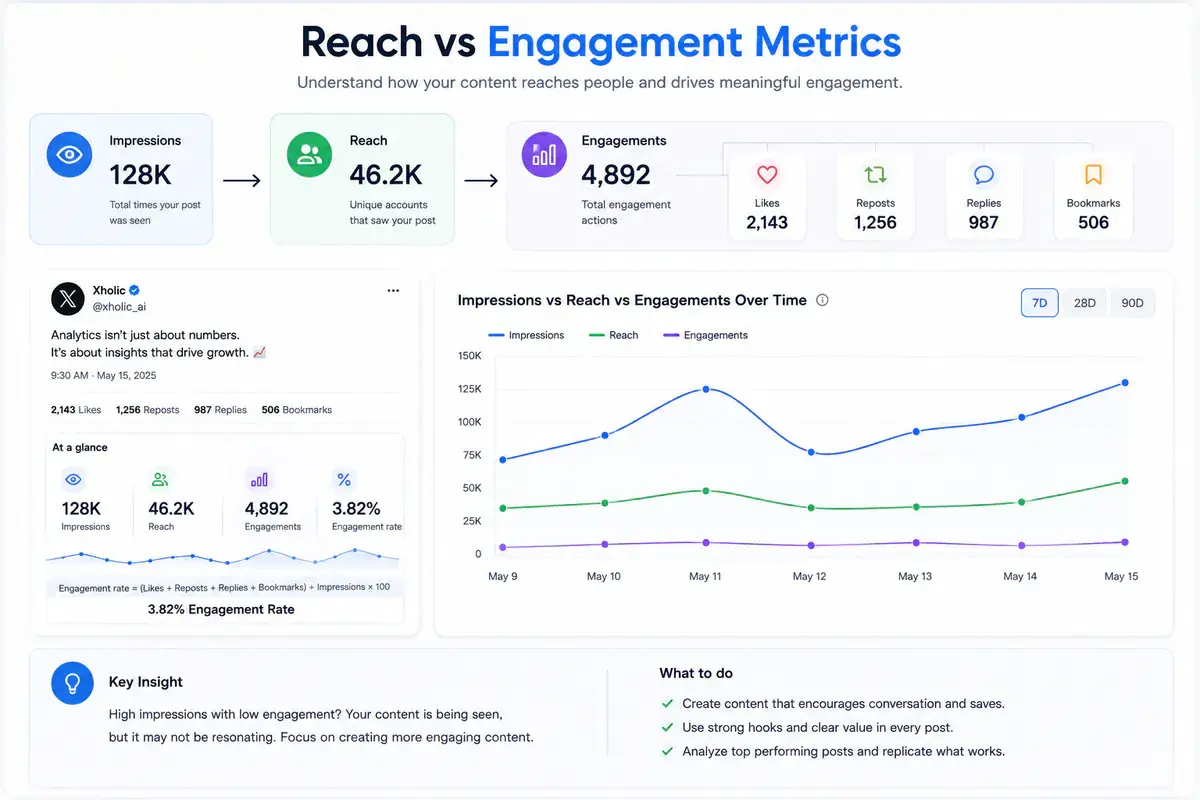
Definition: The total number of times a post was displayed on someone’s screen, whether or not they engaged with it. A single user seeing your post twice can count as two impressions.
Why it matters: Impressions are the denominator for many rate-based metrics, including impressions-based engagement rate. Low impressions relative to your follower count usually point to a distribution problem. The algorithm may not be pushing the content beyond your existing audience.
Benchmark: New accounts under 1,000 followers typically see impressions in the low hundreds per post. Accounts with 10,000 or more followers and a healthy posting cadence may see two to five times their follower count on strong posts, and far less on average posts. For more context, see our Twitter analytics dashboard guide.
Where to find it: X’s native analytics reports impressions for your own posts. Xholic’s X Profile Analytics tool helps organize public profile and post signals in one view.
Reach
Definition: The number of unique accounts that saw your content. Unlike impressions, reach does not double-count repeat views from the same person.
Why it matters: Reach tells you how far a post traveled beyond your core audience. A high impressions-to-reach ratio, with many impressions but relatively few unique viewers, usually means existing viewers saw the post repeatedly rather than the post spreading to new people.
Common confusion: Reach and impressions are often used interchangeably, but they measure different things. If a post gets 10,000 impressions from 2,000 unique accounts, its reach is 2,000 and each viewer saw it five times on average. Our impressions and reach explainer covers the distinction in more detail.
Profile Visits
Definition: The number of times someone clicked through to view your full profile rather than only seeing a post in their timeline.
Why it matters: Profile visits are a strong intent signal. Someone liked what they saw enough to learn more about you. A high engagement rate but low profile-visit count can mean the content is entertaining without creating curiosity about the person or brand behind it.
What to do about it: If your profile-visit-to-follow ratio is weak, review your bio, banner, and pinned post. Start with our X bio examples, Twitter banner guide, and detailed guide to profile visits.
Views (Video and Media Views)
Definition: For video and image content, views count how many times the media itself was viewed or played. This is tracked separately from post impressions.
Why it matters: Video-heavy accounts should track views alongside impressions. The comparison helps show whether people actually watched the media or simply scrolled past the post.
2. Engagement Metrics
Engagement metrics measure what people did after seeing your content. Together, they are one of the strongest signals of content quality.
Likes
Definition: A one-tap acknowledgment that a post resonated. It is a low-effort action and a relatively weak signal on its own, but it becomes useful in aggregate.
Why it matters less than people think: Likes are easy to accumulate and less predictive of business outcomes such as leads or sales. Treat them as a quick sentiment check, not the entire strategy.
Reposts (Retweets)
Definition: A share of your post to another user’s audience, either as a direct repost or a quote repost with added commentary.
Why it matters: Reposts are a primary distribution mechanic on X. Each repost can expose your content to an audience that does not already follow you. A high repost-to-like ratio suggests that people did more than enjoy the post. They were willing to associate their own name with it.
Replies
Definition: Direct responses to your post that appear in the conversation beneath it.
Why it matters: Replies are valuable for community-building because they require more effort than a like. Posts that spark a useful debate, ask a genuine question, or make a specific claim tend to generate more replies than posts optimized only for passive reactions.
Bookmarks
Definition: A private save that lets someone return to your content later. Only the post author can see the aggregate bookmark count, not the identities of the people who bookmarked it.
Why it matters: Bookmarks can signal durable value without the social pressure that sometimes influences likes. Educational, reference-style, and “save this for later” posts often earn more bookmarks relative to likes.
Detail Expands
Definition: The number of times someone opened a post to see the full conversation, media, or additional context.
Why it matters: For threads and longer content, detail expands help show whether the opening post is doing its job of pulling readers deeper.
Engagement Rate
Definition: The percentage of people who saw your content and took an action on it. A common impressions-based formula is:
Engagement rate = (likes + reposts + replies + bookmarks) ÷ impressions × 100
Some tools calculate engagement rate against followers instead of impressions. Always check the denominator before comparing rates across tools because the two methods produce very different results.
Benchmark: Across many accounts, an impressions-based engagement rate of 1-3% is solid, 3-5% is strong, and anything consistently above 5% is exceptional. Smaller accounts often report higher rates because a greater share of impressions comes from engaged followers rather than colder algorithmic reach. Calculate yours with Xholic’s engagement rate calculator or review the full engagement-rate methodology.
3. Growth Metrics
Follower Count
Definition: The total number of accounts currently following you.
Why it matters, and why it does not: Follower count shows audience size but says nothing about audience quality, engagement, or business value by itself. An account with 5,000 highly engaged followers in a defined niche can outperform one with 50,000 disengaged followers for lead generation.
Follower Growth Rate
Definition: The percentage change in followers over a defined period, usually measured weekly or monthly.
Formula: (New followers - unfollows) ÷ starting follower count × 100
Why it matters: Growth rate normalizes for account size, which makes it more useful than a raw follower gain when comparing your trajectory with your own history or with similar accounts. Track changes over time with Xholic’s live follower count tool and use our follower tracker guide to set up a consistent process.
Unfollows
Definition: The number of accounts that stopped following you in a given period. X does not expose this directly in native analytics, so you must infer it from follower-count changes or use a dedicated tracking tool.
Why it matters: A sudden drop after a specific post can signal that the content alienated part of your audience. Treat unfollows as a diagnostic signal, not a vanity metric. See how to see who unfollowed you on Twitter for a full walkthrough.
Follower-to-Following Ratio
Definition: Your follower count divided by the number of accounts you follow.
Why it matters: Other users sometimes treat this ratio as a quick, imperfect credibility signal when deciding whether to follow an account or take it seriously, especially in B2B and thought-leadership contexts.
4. Content Performance Metrics
Link Clicks
Definition: The number of times people clicked an outbound link in your post. This is critical for anyone using X to drive traffic to a website, product, or lead magnet.
Why it matters: Link clicks are closely tied to business outcomes because they represent someone leaving the platform to take a deliberate next step. A post can earn large impression counts and few link clicks when its copy does not create a clear reason to act.
Top Posts
Definition: Your best-performing posts over a selected period, usually ranked by impressions or engagement.
Why it matters: Reviewing top posts monthly is a fast way to identify repeatable patterns in format, topic, posting time, and hook style. Those patterns are the foundation of a useful content calendar.
Video Completion Rate
Definition: The percentage of viewers who watched a video all the way through rather than dropping off partway.
Why it matters: A high view count with a low completion rate usually means the thumbnail or first few seconds worked, but the rest of the video did not hold attention. That is a different problem from low views overall.
5. Monetization Metrics
Ad Revenue Share
Definition: Earnings paid to eligible X Premium creators based on qualifying engagement and X’s current program rules.
Why it matters: X’s revenue model does not reward raw impressions alone. Eligibility and qualifying activity matter, so creators should review the latest platform rules before treating impressions as an earnings forecast. See our X monetization guide and X monetization calculator for more context.
Subscriber Count (Creator Subscriptions)
Definition: The number of people paying for exclusive access to your content through X’s native subscription feature, separate from your general follower count.
Why it matters: Subscribers are followers who value your content enough to pay for more of it, making this a useful audience-quality and monetization signal.
6. Advanced and Business Metrics
Share of Voice
Definition: Your account’s share of engagement or mention volume relative to competitors or the broader conversation in your niche.
Why it matters: Share of voice puts your growth in market context rather than viewing it in isolation. It is especially useful for competitor benchmarking. Our companion guide explains how to track a competitor’s X/Twitter analytics using public signals and clearly labeled estimates.
Audience Quality and Business Readiness
Definition: A composite view of whether your following represents your target customer or audience rather than simply measuring follower count.
Why it matters: Raw metrics can mislead a business when the audience is not the right one. The X Business Readiness Scorecard evaluates factors that a standard analytics dashboard cannot summarize in a single number.
Benchmarks by Account Size
Raw numbers mean little without context. The ranges below are directional benchmarks based on common patterns across accounts. They are not guarantees. Niche, posting frequency, content format, and the denominator used for engagement rate can all shift the result.
| Follower count | Typical engagement rate (of impressions) | Typical impressions per post | Realistic monthly growth rate |
|---|---|---|---|
| 0-1,000 | 3-8% | 100-800 | 10-30% |
| 1,000-10,000 | 2-5% | 500-5,000 | 5-15% |
| 10,000-50,000 | 1.5-4% | 2,000-20,000 | 2-8% |
| 50,000-250,000 | 1-3% | 10,000-100,000+ | 1-4% |
| 250,000+ | 0.5-2% | 50,000+ | 0.5-2% |
Engagement rate as a percentage tends to shrink as follower count grows, even for well-run accounts. That does not necessarily indicate failure. It is often a mathematical consequence of more impressions coming from colder, non-follower audiences rather than warm, already-engaged followers. Check a falling rate against the broader trend before assuming something is wrong.
How These Metrics Work Together
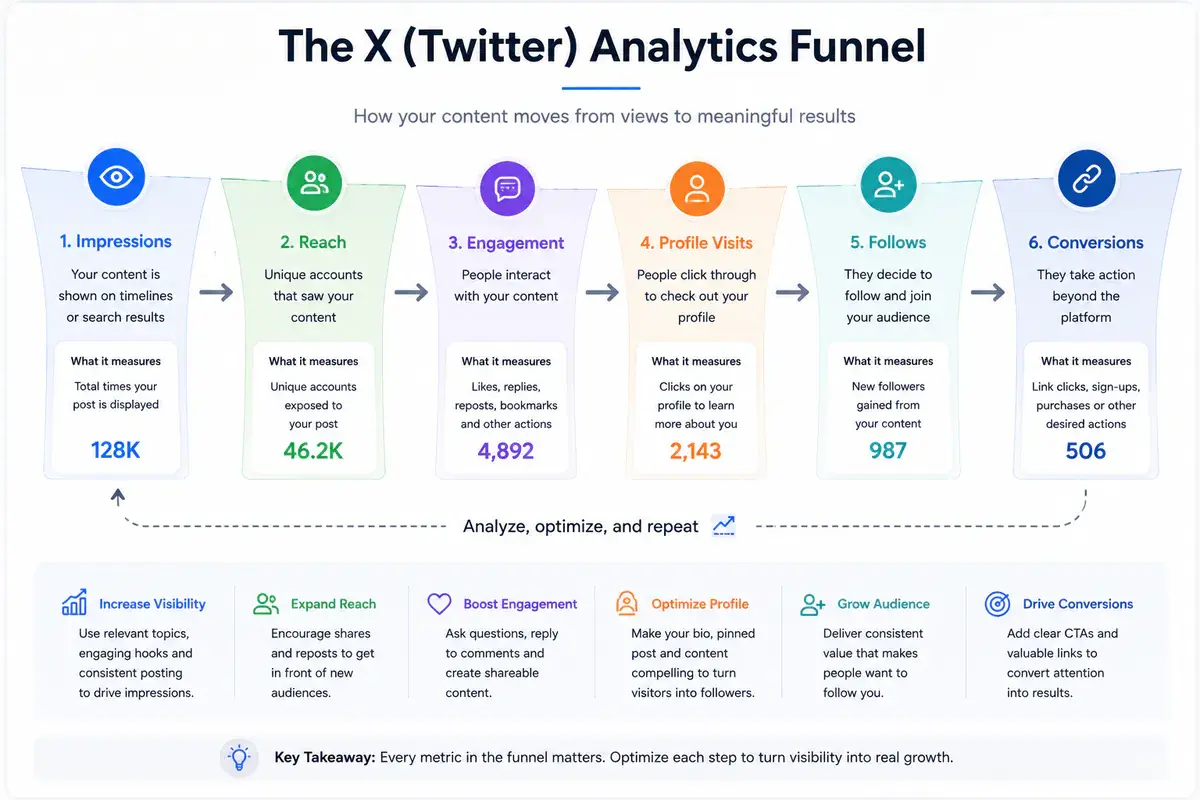
None of these numbers should be read in isolation. Think of them as a funnel:
Impressions → Reach → Engagement → Profile visits → Follows → Link clicks or conversions
Each stage has its own bottleneck, and the metric that needs attention changes depending on where the funnel breaks:
- High impressions, low engagement: The hook or opening line is not earning attention once someone sees the post.
- High engagement, low profile visits: People like the content but are not curious enough about the account behind it. The account may lack a clear, memorable point of view.
- High profile visits, low follows: The bio, banner, or pinned post is failing to close the loop. Revisit the bio examples and common bio mistakes.
- High follows, low link clicks: The audience likes the account but has not been given a clear, low-friction reason to leave the platform.
Diagnosing the weak stage in the funnel is more useful than staring at a single number without context.
A Note on Data Accuracy and Methodology
Metric definitions on X have changed multiple times since 2022. The platform rebrand, the introduction of views as a separate metric, and changes to the analytics product all affect how current data compares with older reports. When comparing historical data with current performance, or comparing numbers from different tools, confirm the metric definition, formula, and time window first.
The same rule applies to competitor data. You can calculate exact values only from metrics the platform exposes publicly. Private impressions, reach, profile visits, and revenue for another account are not available to outside observers. When a third-party tool estimates a metric, treat it as directional and check that the methodology is clearly disclosed.
Common Misinterpretations
- Treating impressions as reach. They are different numbers with different implications.
- Chasing likes over bookmarks and replies. Likes are easy to accumulate and are a weaker indicator of business impact.
- Comparing engagement rates without checking the formula. Some tools use impressions as the denominator and others use followers, so the same account can show very different rates.
- Ignoring unfollows. Native analytics does not surface the number directly, but follower losses can reveal content and audience-fit problems.
- Judging one post instead of a rolling average. Individual post performance is noisy. Trends across 30-90 days are more reliable for decisions.
Native X Analytics vs. Third-Party Tools
X’s native analytics is a useful starting point for data about your own account, but it has practical limits. Dedicated tools can help organize longer-term trends, calculate metrics consistently, and compare public signals across accounts. Our free Twitter analytics tools roundup and Twitter analyzer comparison explain the tradeoffs. For a broader account-health check, use the X Profile Audit tool with its accompanying profile audit guide.
Getting Started: Set Up Your Own Tracking
Knowing the definitions is useful only when you track the same metrics consistently. This lightweight setup works for creators and small teams:
- Pick one dashboard as your source of truth. Switching between tools with different formulas creates inconsistent data. Choose one, such as Xholic’s X Profile Analytics, and use it consistently.
- Set a weekly review cadence. Daily checks are noisy, while monthly checks can be too slow to catch a useful pattern. A 15-minute weekly review of impressions, engagement rate, and follower growth is a practical starting point.
- Log your top three and bottom three posts each week. Over a month, patterns emerge in formats, topics, hooks, and posting times.
- Run a full account audit monthly. A monthly profile audit can catch structural issues with the bio, pinned post, and posting consistency that daily metric checks miss.
- Track follower growth rate, not only follower count. Use a live follower count tool to see changes over time instead of relying on occasional snapshots.
This system gives you enough signal to make informed decisions without turning analytics into a full-time job.

FAQ
What is a good engagement rate on X/Twitter?
For many accounts, 1-3% calculated against impressions is solid, 3-5% is strong, and above 5% consistently is exceptional. Smaller niche accounts often report higher rates because a greater share of their impressions comes from engaged followers.
What is the difference between impressions and reach?
Impressions count every time a post is displayed, including repeat views from the same person. Reach counts unique accounts that saw it. A post can have far more impressions than reach when the same people see it multiple times.
Does X show who unfollowed me?
No. Native X analytics does not identify who unfollowed you. You need to track follower-count changes over time or use a dedicated tool. See our guide to tracking Twitter unfollowers for the available methods and their limits.
Are bookmarks visible to other people?
No. Bookmarks are private to the person who saved the post. The post author can see the aggregate bookmark count, but not who bookmarked it.
How often should I check my analytics?
Review trends weekly and use a monthly review for strategic decisions such as changing content pillars. Checking daily often creates noise because individual post performance varies widely from one day to the next.
What metric matters most for lead generation?
Link clicks and profile visits are close proxies for business intent because both represent a user taking a deliberate next step beyond passive scrolling. Track downstream conversions as well when you can connect them reliably.
Can I track a competitor’s analytics on X?
You cannot see a competitor’s private dashboard, but you can track public follower growth, posting patterns, and visible engagement. Our guide to tracking a competitor’s X/Twitter analytics explains how to separate exact public values from estimates.
This glossary is part of Xholic’s X/Twitter analytics resource hub. To organize public profile and post signals in one dashboard, try the free X Profile Analytics tool.