Free Twitter Engagement Rate Calculator
Enter your own post metrics below, or switch to the public-profile option to estimate visible engagement from recent original posts. The calculator is free and does not require signup.
Calculate X engagement rate
Scan any public handle, or enter your own analytics numbers, and get a benchmarked grade.
Or enter your own numbers
The calculator loads when it approaches the viewport. You can also open the full free calculator in its own page.
If you’re staring at a post that got decent likes but a tiny engagement rate, or comparing two tweets that “felt” equally strong but scored very differently, the confusion usually comes from the denominator. On X, the same post can look great or weak depending on whether you calculate against impressions, followers, or reach.
That’s why a clean measurement system matters more than chasing a single vanity number. In X’s own analytics, an engagement is any interaction with a post: likes, replies, reposts, link clicks, profile clicks, media views, and taps to expand the post. Before you benchmark anything, you need to know what counts, where to pull it from, and how to compare posts fairly.
Why Calculating Your X Engagement Rate Matters
For many, posting on X isn’t the challenge. The struggle lies in interpreting performance correctly. A tweet can collect visible activity and still have a weak engagement rate if it reached far more people than expected, or it can look quiet publicly while still driving meaningful clicks and profile actions.
The first reason to calculate Twitter engagement rate is simple. It tells you whether people who saw the post engaged. That’s more useful than raw likes because it adjusts for distribution.
The second reason is decision-making. When you compare engagement rate across formats, hooks, and posting windows, you start seeing what consistently earns attention instead of what merely got lucky once. That’s the difference between random posting and a repeatable system.
Practical rule: Use engagement rate to compare content quality, not ego. Impressions tell you distribution. Engagement rate tells you response.
The standard formula for X is engagements divided by impressions, multiplied by 100. Metricool’s guide to Twitter engagement uses the same definition, and X’s analytics reports engagement rate on that basis: engagements as a percentage of impressions. Because X counts clicks, profile visits, media views, and detail expands as engagements, the rate in X Analytics is usually higher than one built only from the public counters under a post.
That’s why “engagement” isn’t just hearts and reposts. If your goal is traffic, product discovery, or conversations, the strongest post might not be the one with the most visible social proof.
If you need a more platform-specific primer before building your spreadsheet, Xholic has a useful guide on Twitter engagement.
The 3 Core Formulas for X Engagement Rate
A common reporting problem on X looks like this. One post gets broad distribution and a modest engagement rate. Another gets fewer impressions but a much higher rate. A third does average on both, yet drives the most profile visits or clicks. If you use one formula for every question, you will misread at least one of those posts.
On X, three core formulas cover most practical needs. The right one depends on what you are trying to evaluate: post response, audience efficiency, or repeatable content patterns.
Formula 1 uses impressions
This is the default formula for post-level analysis because it measures response against actual exposure.
Formula
Engagement Rate by Impressions = (Total Engagements / Impressions) x 100
X’s native analytics is built around impressions, so this is usually the cleanest starting point for reporting. If your team needs a shared KPI, make this the primary one unless you have a specific reason not to.
For example, a post with 1,782 engagements and 73,556 impressions works out to about 2.4% (1,782 / 73,556 = 0.0242).
Spreadsheet formula
=(A2/B2)*100
If:
- A2 = engagements
- B2 = impressions
Use this when:
- you’re comparing individual posts
- you want numbers that align closely with native X Analytics
- your posts often reach people who do not follow the account
This method only works if your team understands the denominator. If anyone on the team is still mixing up views, reach, and impressions, use this guide on what an impression means on Twitter before building your sheet.
Formula 2 uses followers
This formula answers a different question. It measures engagement against audience size, not against how many times the post was shown.
Formula
Engagement Rate by Followers = (Total Engagements / Followers) x 100
Spreadsheet formula
=(A2/C2)*100
If:
- A2 = engagements
- C2 = follower count
Use this when:
- you’re comparing account efficiency over time
- you need a rough benchmark across accounts with similar follower counts
- leadership wants a simple audience-relative metric
Use it carefully. Follower-based engagement rate can distort post performance when distribution extends far beyond your existing audience. That happens often on X, especially for strong reply posts, timely commentary, and repost-heavy content.
Follower rate is best treated as an account-level context metric. It is a weak substitute for post-level performance.
Formula 3 measures engagement rate per tweet, then compares patterns
The third method is where analysis starts becoming useful for editorial decisions. Instead of stopping at one account average, calculate engagement rate for each original post and then segment the results.
For each tweet, use the impressions-based formula:
Per Tweet ER = (Tweet Engagements / Tweet Impressions) x 100
Spreadsheet formula
=(D2/E2)*100
If:
- D2 = tweet engagements
- E2 = tweet impressions
Then sort or filter by:
- media type
- posting time
- content format
- topic
- hook style
This is the method I use when a team wants to know what to repeat next month. Account averages are fine for reporting up. Per-tweet analysis is what helps you decide whether short text posts, threads, clips, screenshots, or product notes are working.
It also exposes trade-offs. A format can earn fewer likes but more link clicks. A high-ER post can still be a weak business post if the engagement is mostly low-intent actions. A lower-ER thread can be more valuable if it drives profile visits, follows, or site traffic.
Here’s the clean way to choose:
| Method | Best for | Main weakness |
|---|---|---|
| By impressions | Post-level performance against exposure | Can look lower on broadly distributed posts |
| By followers | Audience-relative efficiency | Ignores actual post exposure |
| Per tweet analysis | Finding repeatable content patterns | Requires cleanup and tagging |
If your team is early in its reporting setup, start with impressions-based ER for every original post. Then add follower-based ER for account context. Finally, build a per-tweet sheet if you want to find patterns you can use.
How to Find Your Data in X Analytics

You don’t need a complex stack to calculate Twitter engagement rate. For basic analysis, native X Analytics gives you enough to start.
Where the numbers live
X has changed where analytics live several times, and the full account dashboard is now tied to an X Premium subscription. Labels move, but the numbers you need are the same: impressions, engagements, and X’s own engagement rate for each post.
There are two places to look:
- Post activity. Under any of your own posts, the chart icon opens that post’s stats: impressions plus the breakdown of likes, replies, reposts, bookmarks, profile visits, link clicks, and detail expands. This is the quickest way to grab numbers for one post.
- The analytics dashboard. On a Premium account, the analytics section lists your posts with impressions, engagements, and engagement rate side by side, which is better for reviewing a month at once.
Focus on original posts first. If you dump everything into one view without filtering, replies and repost-style activity can muddy the picture.
The fastest manual workflow looks like this:
- Open analytics, or the post activity view for one post
- Filter to original posts for the period you are reviewing
- Note impressions and engagements per post
- Compare against X’s engagement rate column, if your view shows one
- Open individual posts when you need the engagement breakdown
If you want a visual walkthrough, this guide on how to see Twitter analytics is a practical reference.
What to export for analysis
Native analytics becomes much more useful once you get the data into a sheet, either through the dashboard’s export option (if your account has it) or by copying post activity numbers by hand. That lets you sort, filter, and segment instead of eyeballing posts one by one.
Then build columns for:
- Date
- Post text or label
- Impressions
- Engagements
- Engagement rate
- Media type
- Posting time
- Content format
- Original post or reply
Once you’ve got the export, don’t just compute one account-wide average. Create views for text posts, image posts, video posts, and threads separately. That’s where you stop guessing.
A short walkthrough can help if you’re setting this up for the first time:
One practical note: your analytics dashboard is useful for inspection, but your spreadsheet is where the detailed analysis happens. Native tools show you what happened. Your own categorization shows you why.
How to Use the Free Calculator
The calculator at the top of this page is the same Twitter engagement rate calculator that runs on its own tool page. It applies the impressions formula for you and grades the result against accounts with a similar follower count. You can either type in numbers from X Analytics or scan a public profile.
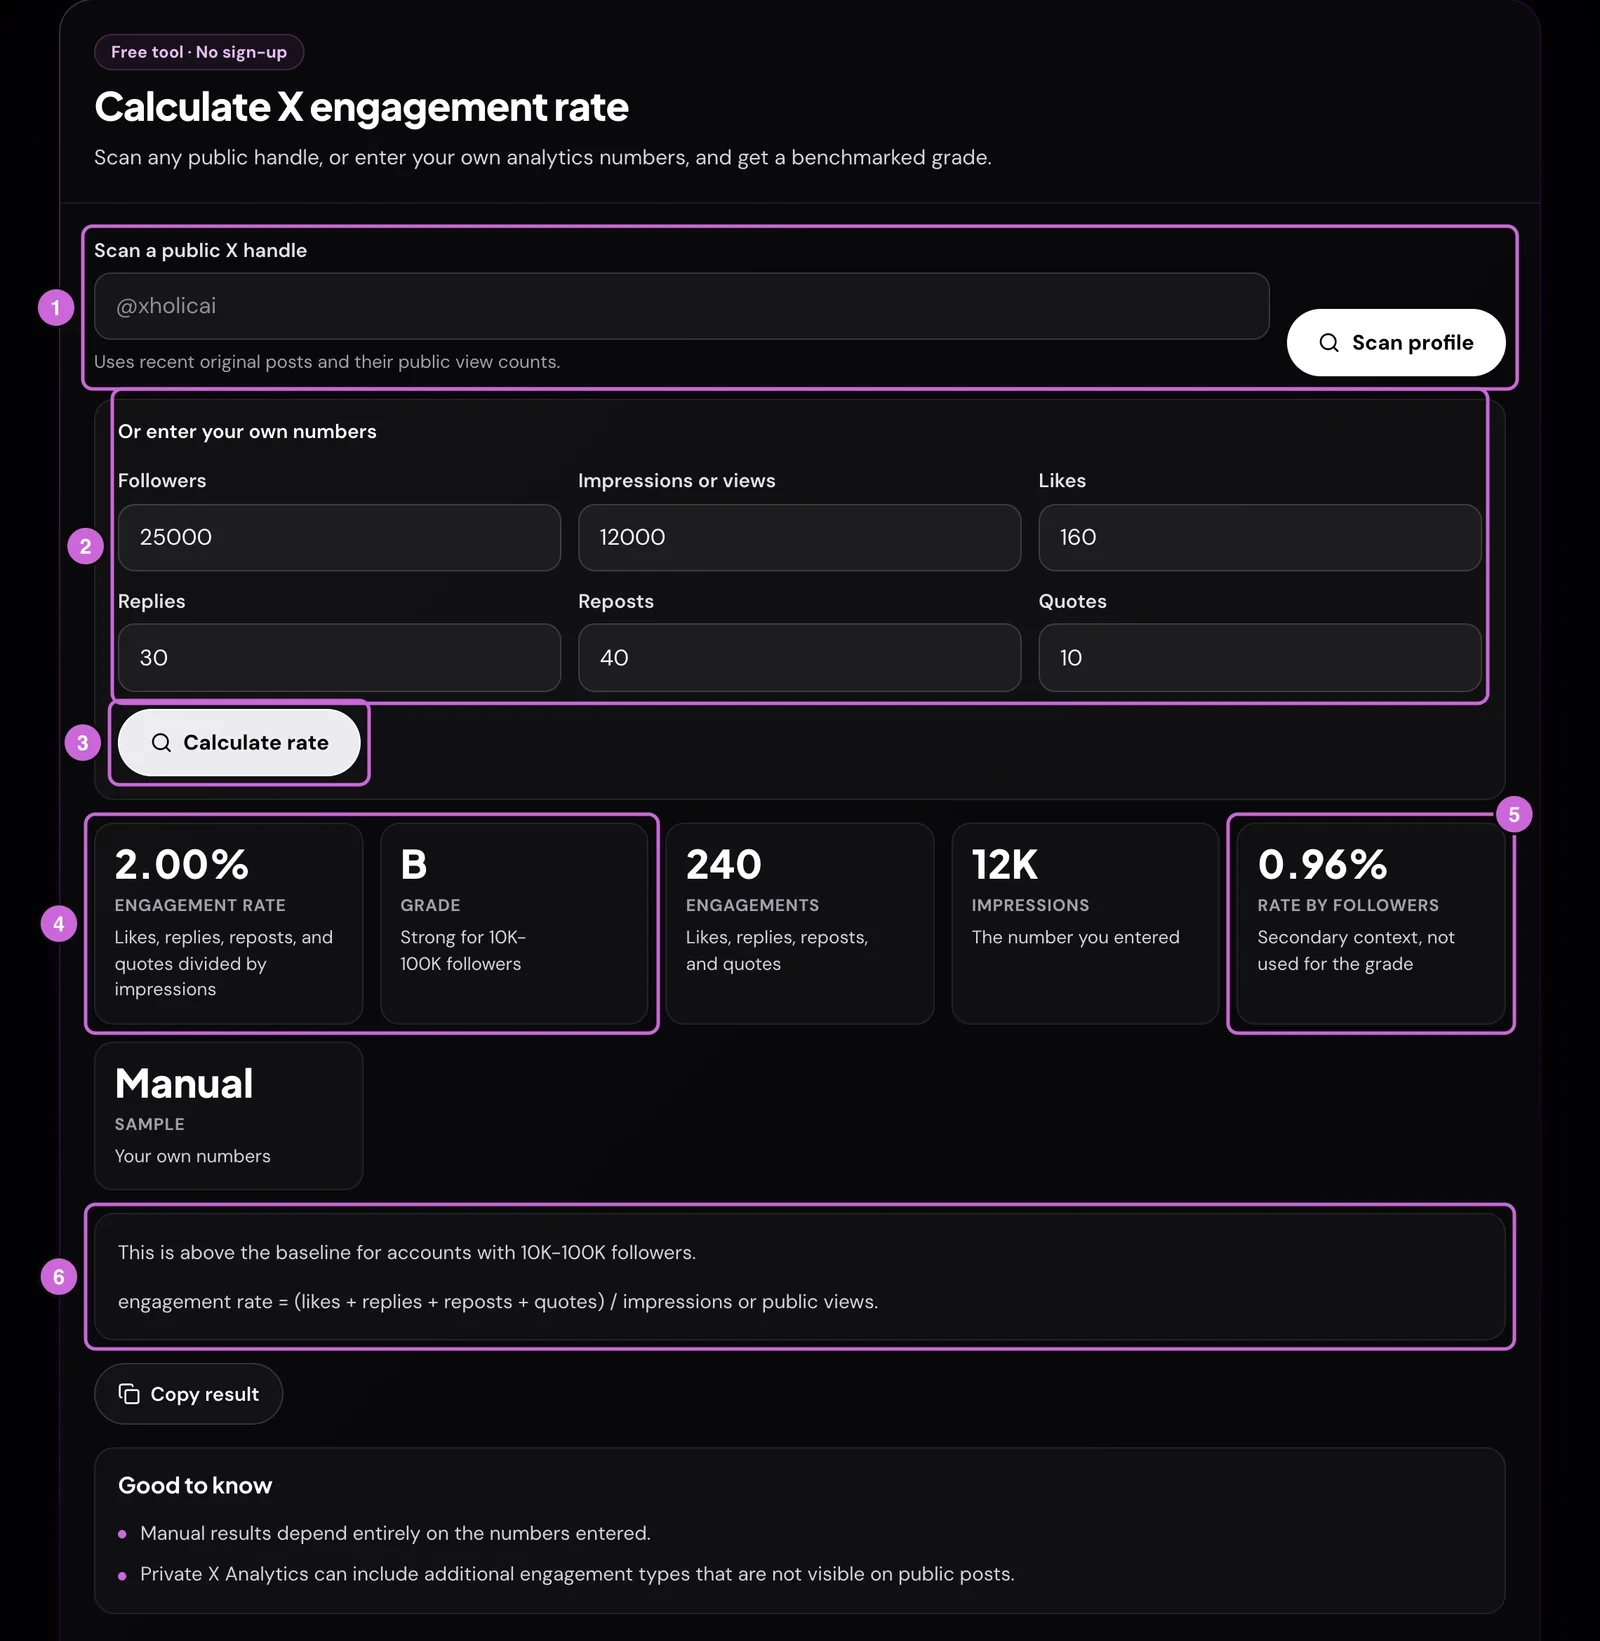
- Scan a public handle (optional). Type a handle such as
@xholicai, or paste a profile link from x.com or twitter.com, and choose Scan profile. Skip this step if you have your own analytics numbers. - Open “Or enter your own numbers” and fill in the six fields: Followers, Impressions or views, Likes, Replies, Reposts, and Quotes. Commas and spaces are fine, and a blank field counts as 0.
- Choose Calculate rate. In the example above, 160 likes, 30 replies, 40 reposts, and 10 quotes add up to 240 engagements.
- Read the engagement rate and grade. 240 engagements on 12,000 impressions is 2.00%, which grades B, “Strong for 10K-100K followers” for an account with 25,000 followers.
- Check the rate by followers. 240 / 25,000 = 0.96%. The calculator shows it as context only. It never feeds the grade.
- Confirm what was counted. The note under the results states the benchmark verdict and the exact formula used. Copy result copies a one-line summary such as “2.00% engagement rate (grade B)”.
What the calculator counts
The calculator’s numerator is likes + replies + reposts + quotes. It does not add bookmarks, link clicks, profile visits, or detail expands, even though X Analytics counts those as engagements. That means the calculator’s rate will usually be lower than the engagement rate X shows for the same post.
If you want the calculator to match X’s number, enter X’s total engagements in the Likes field and leave Replies, Reposts, and Quotes blank. The sum is the same, so the rate and grade will line up with your analytics.
How the grade works
The grade compares the impressions-based rate with a benchmark for the account’s follower tier. Larger accounts reach more passive viewers, so the bar drops as follower count rises. The same 2.00% post grades differently depending on who published it:
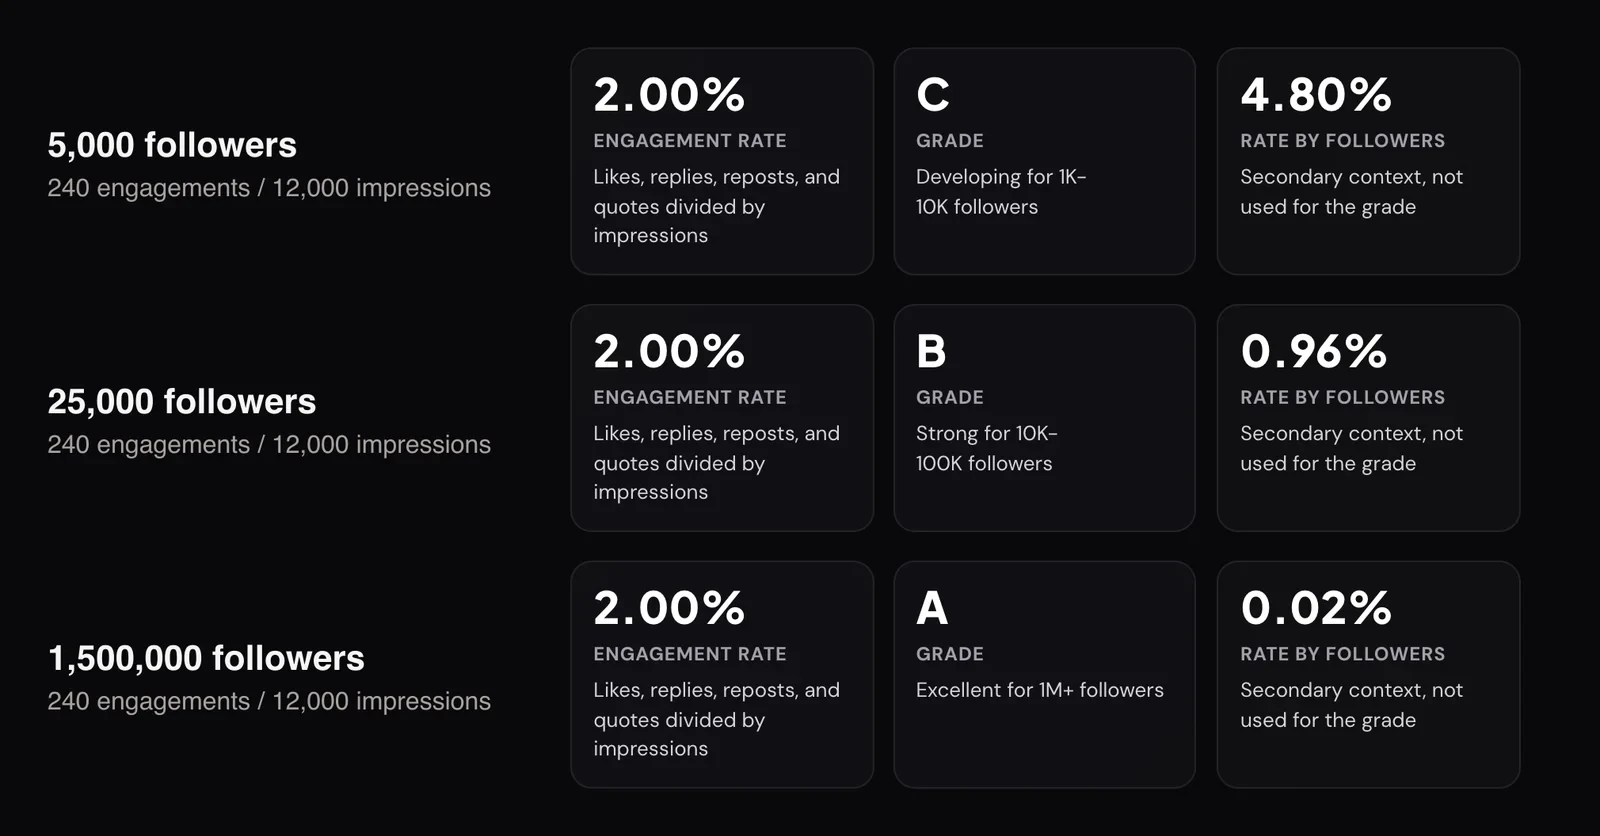
The full set of thresholds is in the benchmarks by follower count table below. Always fill in Followers. If you leave it blank, the calculator still shows the engagement rate, but the grade reads “n/a” with a prompt to enter your followers, and the rate by followers shows as “n/a”.
Scanning a public profile
A profile scan estimates engagement for any public account, including ones you do not manage. Here is the scan for our own account, @XholicAI:
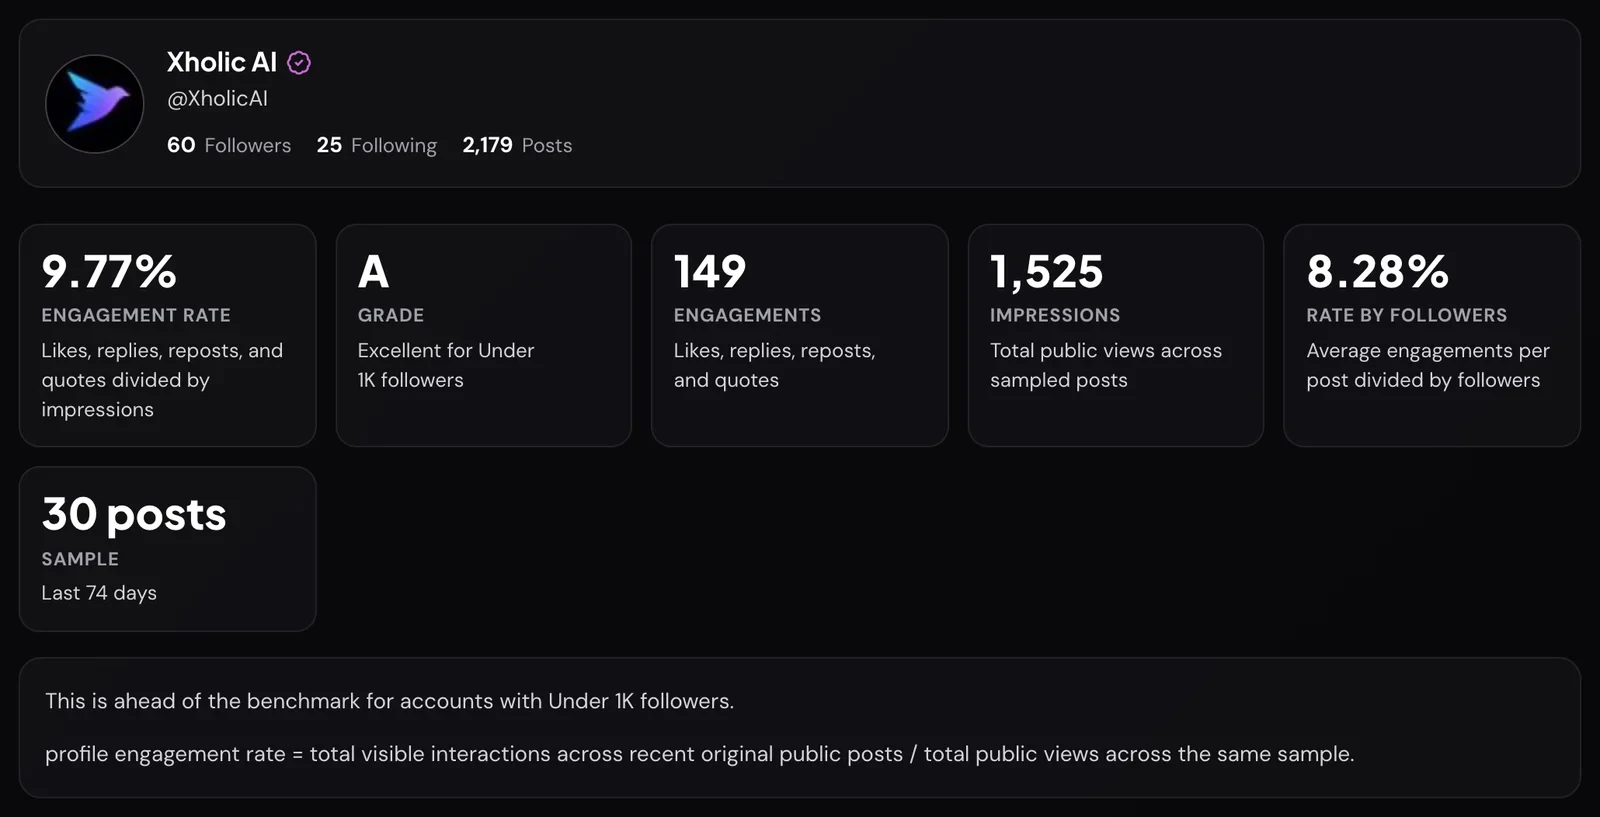
How the scan works:
- It samples up to 30 recent original posts. Replies and reposts are left out.
- Public view counts stand in for impressions, because private analytics are not available for other people’s accounts.
- It needs at least 3 original posts to give a grade. With fewer, the grade card says “Needs at least 3 original public posts for a grade”. Under 10 posts, treat the grade as directional.
- It lists up to six top posts in the sample, each with an “Open on X” link.
- You can share a scan by adding the handle to the URL, for example
/tools/twitter-engagement-rate-calculator/?handle=xholicai. The scan runs as soon as the page opens.
In a profile scan, rate by followers is a per-post figure: average engagements per sampled post divided by followers. For @XholicAI that is 149 / 30 / 60, which the scan shows as 8.28%, which you can compare with a single post’s follower rate.
If the calculator shows an error
- “Enter impressions or views greater than 0. The rate is engagements divided by impressions.” Impressions is the only required field. Copy it from post activity or your analytics view.
- “Likes must be a whole number of 0 or more.” (or the same message for another field). Use plain digits. Shorthand like “12K” and negative numbers are rejected. Decimals are cut to whole numbers.
- “X handles use 1–15 letters, numbers, or underscores. Check the spelling.” The handle or link is malformed. Remove spaces and extra characters.
- “We couldn’t find that account on X. Check the spelling, or the account may be suspended or deleted.” The handle has a valid format, but no matching public account came back.
What Is a Good Engagement Rate on X in 2026
Many teams misread X by applying Instagram or LinkedIn expectations to a platform with much lower baseline engagement rates. On X, a tiny percentage can still signal strong performance. The first thing to check is which denominator a benchmark uses, because published X benchmarks mix two very different scales.
Follower-based brand benchmarks are tiny. The 2026 Social Media Industry Benchmark Report from Quid (formerly Rival IQ) puts the all-industry median engagement rate per X post, by followers, at 0.03%, up from 0.015% the year before. Metricool’s engagement guide cites an earlier cross-industry average of 0.029%. These figures describe brand accounts posting to large, mostly passive follower bases.
Impressions-based rates for individual posts sit in whole percentages. Dividing by the number of times a post was actually seen produces much larger numbers, usually whole percentages rather than hundredths of a percent. That is the scale X Analytics and this calculator use. Never compare a 2% impressions rate with a 0.03% follower benchmark. They measure different things. For follower-based ranges by account size, see what counts as a good Twitter engagement rate by followers.
That changes how you interpret results. Within the same method, a move that looks small on paper often points to a better topic choice, stronger opening line, cleaner audience targeting, or better timing. Benchmark sources on this page were last checked on October 7, 2026.
For account reviews and reporting, pair this metric with reach, clicks, and follower growth inside your Twitter analytics workflow.
What good means in practice
A good engagement rate on X depends on the job of the post and the audience that saw it.
A niche founder account with 8,000 followers can outperform a large brand account on replies and profile clicks. A product post can underperform on likes and still succeed if it drives qualified traffic. A debate-driven post can produce a high engagement rate for the wrong reason if the replies are off-topic or hostile.
Use three filters before you label any post as good or bad:
- Account type. Creator, brand, media account, founder, and support account benchmarks are not interchangeable.
- Post objective. Awareness, conversation, clicks, follows, and conversions produce different engagement patterns.
- Distribution source. Posts shown mostly to non-followers often behave differently from posts shown to your core audience.
Start with your own baseline. Compare the last 20 to 50 original posts by format, then use industry benchmarks as a reference point rather than a pass-fail score.
A practical interpretation framework:
| If your rate is… | Ask this question |
|---|---|
| Below your recent norm | Did the topic, hook, or format fail to earn attention? |
| Near your recent norm | Is this dependable performance, or a sign the content has plateaued? |
| Above your recent norm | Which variable changed: topic, structure, timing, media, or audience fit? |
| Low publicly but strong on clicks or replies | Did the post do its job even without visible social proof? |
The trade-off matters. Posts built for reach often collect lightweight engagement. Posts built for intent often earn fewer likes but more clicks, replies, saves, follows, or profile visits.
So define “good” by outcome fit. The right standard is the match between audience response and the purpose of the post.
Common Pitfalls That Skew Your Engagement Data
Bad engagement analysis usually stems from messy inputs and unfair comparisons.
The calculation is the easy part. The hard part is making sure each post is being judged against the right denominator, the right engagement definition, and the right peer group. If those inputs are off, your spreadsheet will still produce a neat number. It just will not mean much.
Mixing unlike posts
A single average across every post type hides the pattern you need to see. Text posts, videos, screenshots, polls, link posts, threads, and replies draw different kinds of response. If you lump them together, strong performance in one format can cover weak performance in another.
A simple fix works well. Export your post data, calculate engagement rate per post, then split the sheet into clear buckets. Use separate views for:
- Original posts
- Replies
- Text-only posts
- Media posts
- Link posts
- Threads
This matters in practice. Replies often pick up fast engagement because they sit inside an existing conversation. Link posts often earn fewer visible interactions but drive more clicks. Threads can pull strong totals because they create multiple points of interaction. If you compare all three in one average, you will optimize for a blended number that does not describe any real content behavior.
Using the wrong engagement definition
Teams get into trouble when they treat “engagement” as if it means the same thing in every report. On X, that numerator can include likes, replies, reposts, bookmarks, link clicks, profile clicks, media views, follows, hashtag clicks, and other post-level actions, depending on the export or tool.
So document the numerator. If one report uses all engagements and another uses only public interactions, those rates are not comparable. The trend line may look better or worse for reasons that have nothing to do with content quality.
Check the numerator before you judge the result. A rate is only useful if the engagement definition stays consistent.
I recommend adding one column header in the reporting sheet called Engagement included and filling it in once for the whole tab. It sounds basic, but it prevents a common reporting mistake.
Reading one post in isolation
One breakout post can distort a monthly average. One weak post can make a format look worse than it is. That is why single-post analysis should lead to group analysis, not replace it.
Review posts in clusters. Compare a post against others with the same format, similar topic, and similar goal. Ask:
- Was it strong for this format?
- Was it strong for this topic?
- Was it strong for this objective?
- Did it beat similar posts from the same account?
This approach gives you something you can act on. A post might look mediocre in a full-month view but perform well against other link posts. That suggests the format is viable and the benchmark was wrong, not the post.
Using the wrong denominator
Follower-based engagement rate is useful for account-level consistency. It is less useful for judging a post that reached far beyond your follower base. If non-followers drove most of the impressions, a follower-based rate can overstate or understate performance depending on the size and behavior of your audience.
In those cases, impressions-based ER gives a cleaner read because it reflects exposure.
Use the denominator that matches the question:
- Followers for account-level audience response
- Impressions for post-level efficiency
- Reach if your tool reports unique viewers and you want audience penetration
Pick one primary method for recurring reports, then use the others as secondary views when the distribution pattern calls for it. That keeps your analysis stable without ignoring context.
From Measurement to Growth: A Workflow to Improve Engagement
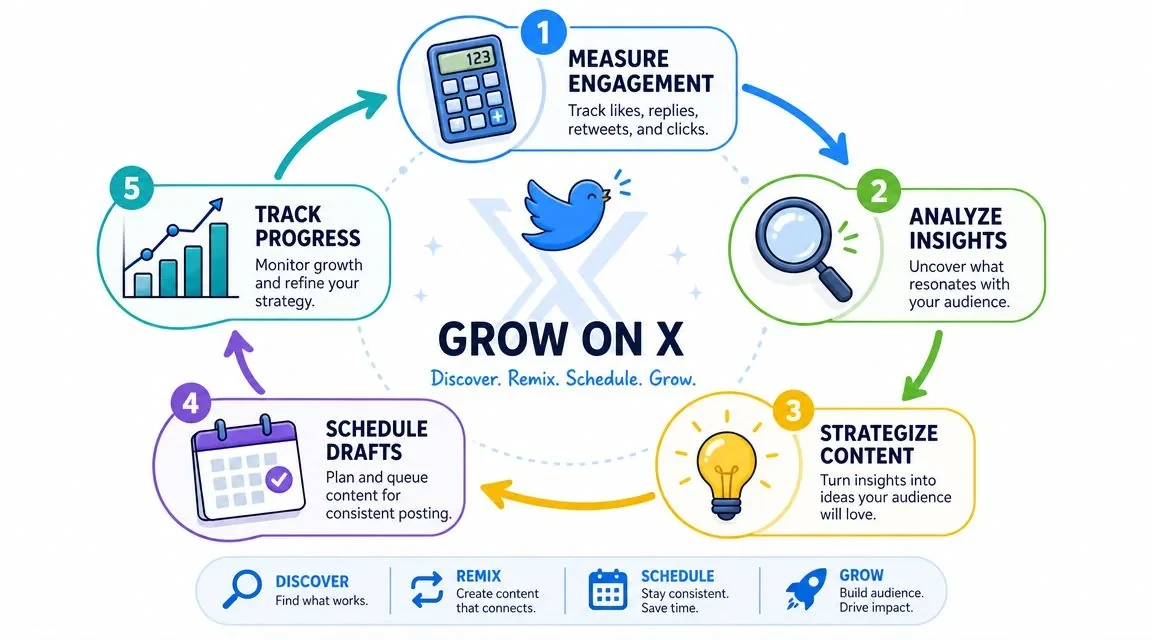
The point of calculating Twitter engagement rate isn’t to admire dashboards. It’s to make better posting decisions next week.
A simple weekly operating loop
Use this workflow if you want engagement analysis to produce actual changes.
-
Pull the last batch of original posts
Export your recent tweet data and filter out replies if your goal is original-content analysis. -
Calculate ER per post
Use the impressions-based formula as your primary view. -
Label each post
Add tags for topic, hook type, format, and goal. For example: “founder lesson,” “contrarian take,” “product tip,” “story post,” or “traffic post.” -
Sort winners and underperformers
Look for recurring traits, not isolated anecdotes. -
Turn findings into your next posting batch
Repeat the formats and hooks that earned response.
It is at this point that many teams falter. They measure, notice a pattern, then go right back to random posting.
A better loop is:
- Audit
- Tag
- Identify patterns
- Draft new posts from proven patterns
- Publish consistently
- Review again
An X specific example
Say you review a month of original posts and notice these patterns:
- Short opinion posts get the most replies
- Screenshots with commentary earn saves and reposts
- Direct product posts get fewer likes but stronger click intent
- Replies to larger accounts bring profile visits but shouldn’t be mixed into original-post averages
That leads to a cleaner content plan:
| Day type | Post style | Main goal |
|---|---|---|
| Insight day | Short opinion tweet | Replies |
| Proof day | Screenshot plus commentary | Reposts |
| Product day | Clear use-case post | Clicks |
| Conversation day | High-quality replies | Visibility |
Here’s a simple X example:
“Most founders don’t need more content ideas. They need one repeatable format they can publish every week without thinking.”
If that kind of post consistently beats your average, don’t just celebrate it. Build variants:
- swap founder for creator or marketer
- change “content ideas” to “growth tactics”
- turn the statement into a question
- expand it into a short thread
That’s how engagement rate becomes a production system. Measure the response, isolate the structure, and publish smarter versions of what already works.
Frequently Asked Questions About X Engagement
How often should I calculate my engagement rate
For account health, review a rolling recent sample regularly. For content decisions, calculate it per tweet. The combination matters because one shows trend direction and the other shows what was effective.
What counts as engagement on X
X engagement can include likes, replies, reposts, follows, link clicks, hashtag clicks, media clicks, and profile interactions. The exact mix depends on the data source and reporting setup, so define your engagement inputs before you compare results.
Is impressions based engagement rate better than follower based engagement rate
For X-specific post analysis, yes. It’s usually the most practical method because it uses actual post exposure. Follower-based rate is still useful, but it’s better as a secondary lens.
Why does my engagement rate look so low on X
Because platform benchmarks are low and distribution is uneven. A post can reach a large number of people who scroll past, which expands impressions faster than engagements. On X, low percentages can still be meaningful.
Should I include replies in my average
Not if you’re judging original-content performance. Replies often have different impression patterns and can skew the average. Keep a separate view for reply performance.
Do quote tweets count the same as likes and replies
They’re part of the wider engagement picture, but they often play a different role. Quote-driven discussion can expand reach and change how a post travels, so it’s worth inspecting separately when you review high-signal tweets. The free calculator weights a quote the same as a like, reply, or repost.
What does total engagements mean on X
In X Analytics, total engagements is the number of times people interacted with a post in any way: likes, replies, reposts, bookmarks, link clicks, profile clicks, media views, and taps to expand the post. That is why it is usually much larger than the likes, replies, and reposts you can see under the post.
Why is the calculator’s rate lower than X Analytics
The calculator counts only likes, replies, reposts, and quotes, while X Analytics also counts clicks, profile visits, media views, and expands. To match X’s figure, enter X’s total engagements in the Likes field and leave the other engagement fields blank.
Why doesn’t my profile scan show a grade
The scan needs at least 3 recent original posts. If the account mostly replies or reposts, the rate is still shown, but the grade card reads “n/a”. Post a few original updates, or enter your own numbers manually.
If you want to spend less time manually digging through posts and more time acting on what works, try Xholic AI. It helps you discover high-momentum tweets, organize research, draft better replies, remix proven structures, and stay consistent without living in the X feed all day.
Twitter Engagement Rate Benchmarks by Follower Count
Engagement rate normally compresses as an audience grows, so compare your result with accounts of a similar size and use the same formula each time. The table below shows the impressions-based thresholds the free calculator uses for its grades. They are Xholic’s working calibration for public engagements (likes, replies, reposts, and quotes divided by impressions), not figures from an industry study.
| Follower tier | Developing (C) | Strong (B) | Excellent (A) |
|---|---|---|---|
| Under 1K | 2%+ | 4%+ | 8%+ |
| 1K to 10K | 1.5%+ | 3%+ | 6%+ |
| 10K to 100K | 1%+ | 2%+ | 4%+ |
| 100K to 1M | 0.6%+ | 1.25%+ | 2.5%+ |
| 1M+ | 0.3%+ | 0.75%+ | 1.5%+ |
A rate below the Developing threshold grades D, “Needs work”. These are calibration ranges, not guarantees. Niche, content format, audience quality, and posting cadence can materially change the result, and follower-based rates use a different scale entirely (see the follower-based benchmarks). Use the total or median across recent original posts so one viral result does not distort the account-level benchmark.
Format matters too: questions and polls reduce the effort required to respond, while a well-structured thread can increase replies, bookmarks, and reposts. Compare like with like before deciding that one format is outperforming another.
Related Xholic Resources
If you are evaluating a multi-post thread rather than one post, use the Twitter Thread Retention Calculator to compare opening hold, middle exposure, end exposure, and the largest adjacent drop.