How to read, understand, and actually use your X data to grow - without paying for Premium
Quick answer: Twitter analytics tracks your impressions, engagement rate, follower growth, profile visits, and link clicks. The full account dashboard is at analytics.twitter.com and currently requires X Premium ($8/month+) on desktop. Free users can still see per-post stats on mobile. For free analytics without Premium, tools like Xholic AI surface key metrics directly inside your Twitter interface.
Here is the honest situation with Twitter analytics in 2026: X has gradually moved its best data behind a paywall, most guides still describe the old free dashboard as if nothing changed, and the gap between what free users can see and what Premium users can see is now meaningful.
This guide covers all of it, the free options, the Premium dashboard, exactly what every metric actually means, how to calculate engagement rate yourself, what benchmarks to aim for, and how to use Xholic AI to fill the gaps without paying for X Premium. No filler, no generic advice.
If you already know the basics and want to jump straight to something specific: use the section headers to navigate. We have covered everything from accessing the dashboard to what your engagement rate actually tells you to a full FAQ targeting the questions Google and AI assistants are surfacing most.
What Is Twitter Analytics - and What Does It Actually Show You?
Twitter analytics is the platform’s built-in system for measuring how your content performs and how your account grows over time. It tracks every interaction on every tweet, how many times it was seen, how many people clicked, replied, liked, retweeted, or followed you from it, and aggregates that data into dashboards you can analyse.
At the account level, you get trend data: is your reach growing or shrinking? Are people actually engaging with your content or just scrolling past it? At the post level, you get a breakdown of exactly what happened to each individual tweet.
Key insight: X has 586 million monthly active users in 2026. That is a lot of noise. Analytics is the only way to find the signal - the content and timing that actually reaches and resonates with your specific audience.
What Twitter analytics can tell you
- Impressions: how many times your tweets appeared in someone’s feed, search, or profile
- Engagement rate: the percentage of people who saw your tweet and did something with it
- Profile visits: how many people clicked through to your profile (a signal of interest beyond a single tweet)
- Follower growth: net new followers over time, showing whether your growth is trending up or down
- Link clicks: how many people clicked links in your tweets - the closest proxy to actual traffic you drove
- Video metrics: views, completion rate, watch time for video content
- Top tweets: which posts performed best in a given period, and why
What Twitter analytics cannot tell you
- Who specifically viewed your tweets: you only see aggregate counts, never individual usernames
- Who unfollowed you: only daily net follower change, not identity of unfollowers
- How you compare to competitors: no benchmarking tools in native analytics
- Audience demographics (age, gender, interests): these were removed from the free dashboard in 2020
- More than 90 days of exportable history without third-party tools
For the things native analytics cannot show, tools like Xholic AI and the Twitter follower tracker tools in our separate guide fill the gap.
Twitter Analytics in 2026: What’s Free vs. What Requires Premium
This is the section most guides skip over or obscure. Here is the actual situation.
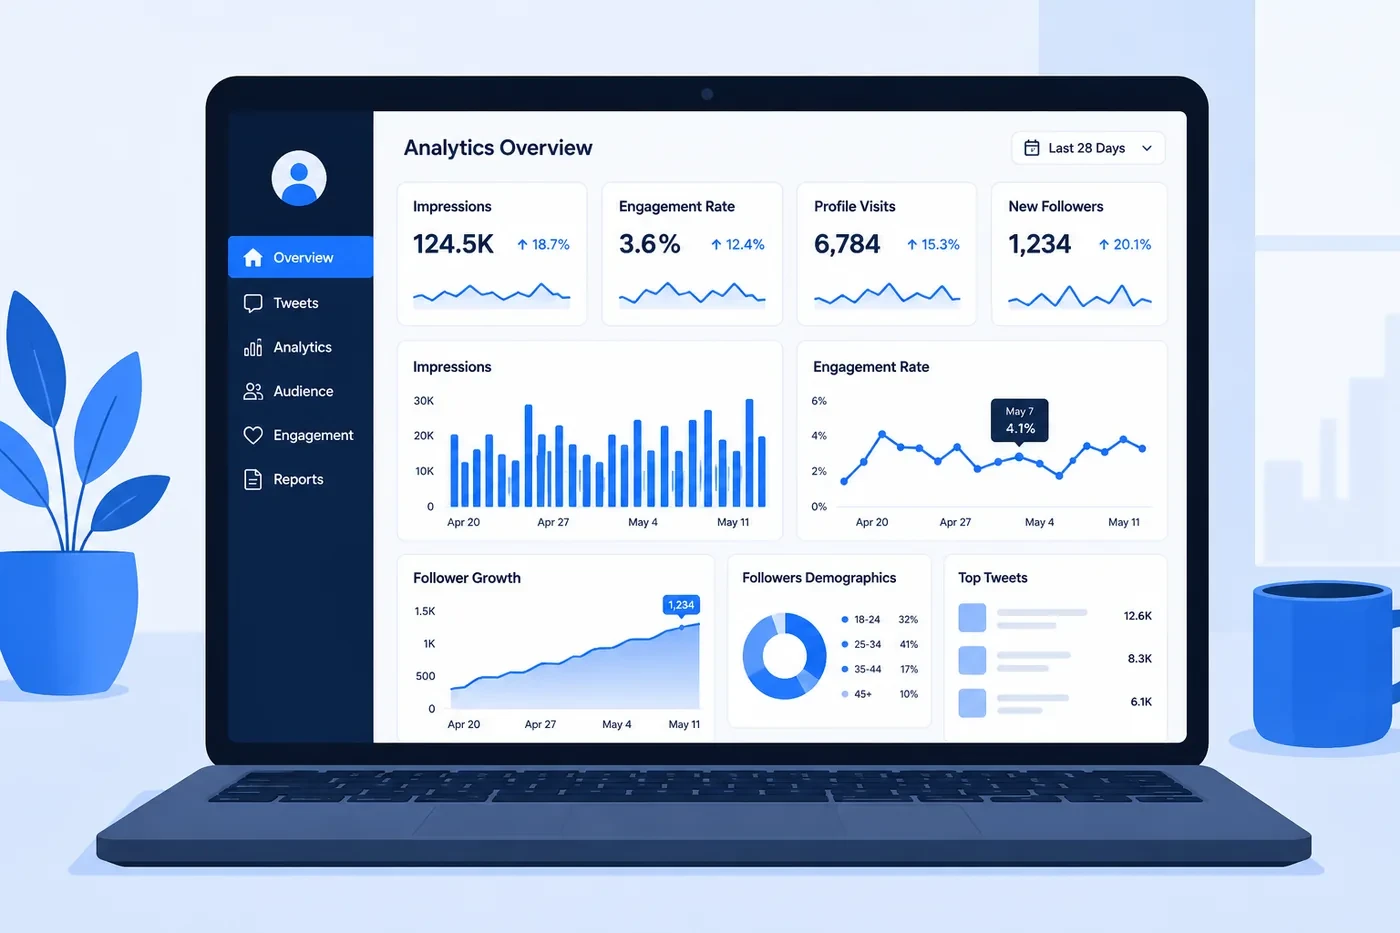
Important: X’s full account-level analytics dashboard now requires X Premium (formerly Twitter Blue). Free accounts can still see per-post stats on mobile, but the comprehensive dashboard - follower trends, account-level impressions, top tweets over time - is Premium-only on desktop.
| Feature | Free Account | X Premium ($8-22/mo) |
|---|---|---|
| Per-post stats on mobile (likes, reposts, replies, views) | Available | Available |
| Full account analytics dashboard (analytics.twitter.com) | Not available | Available |
| 28-day account overview (impressions, profile visits) | Not available | Available |
| Follower growth trend chart | Not available | Available |
| Top tweets ranking over a period | Not available | Available |
| Export tweet activity to CSV (up to 90 days) | Not available | Available |
| Video analytics (completion rate, watch time) | Not available | Available |
| Third-party tools (Xholic AI, etc.) | Available | Available |
Pro tip: If you are not ready to pay for X Premium, you are not stuck flying completely blind. Xholic AI’s Chrome extension surfaces follower trends, engagement data, and per-post performance directly inside your Twitter interface - no Premium subscription required. More on this in the tools section below.
How to Access Twitter Analytics (Step by Step)
There are three ways to get to your analytics data: the native dashboard on desktop (Premium), per-post stats on mobile (free), and third-party tools. Here is how to access each one.
Option A: Native Dashboard on Desktop (Premium Required)
Step 1 Go to analytics.twitter.com or use the sidebar
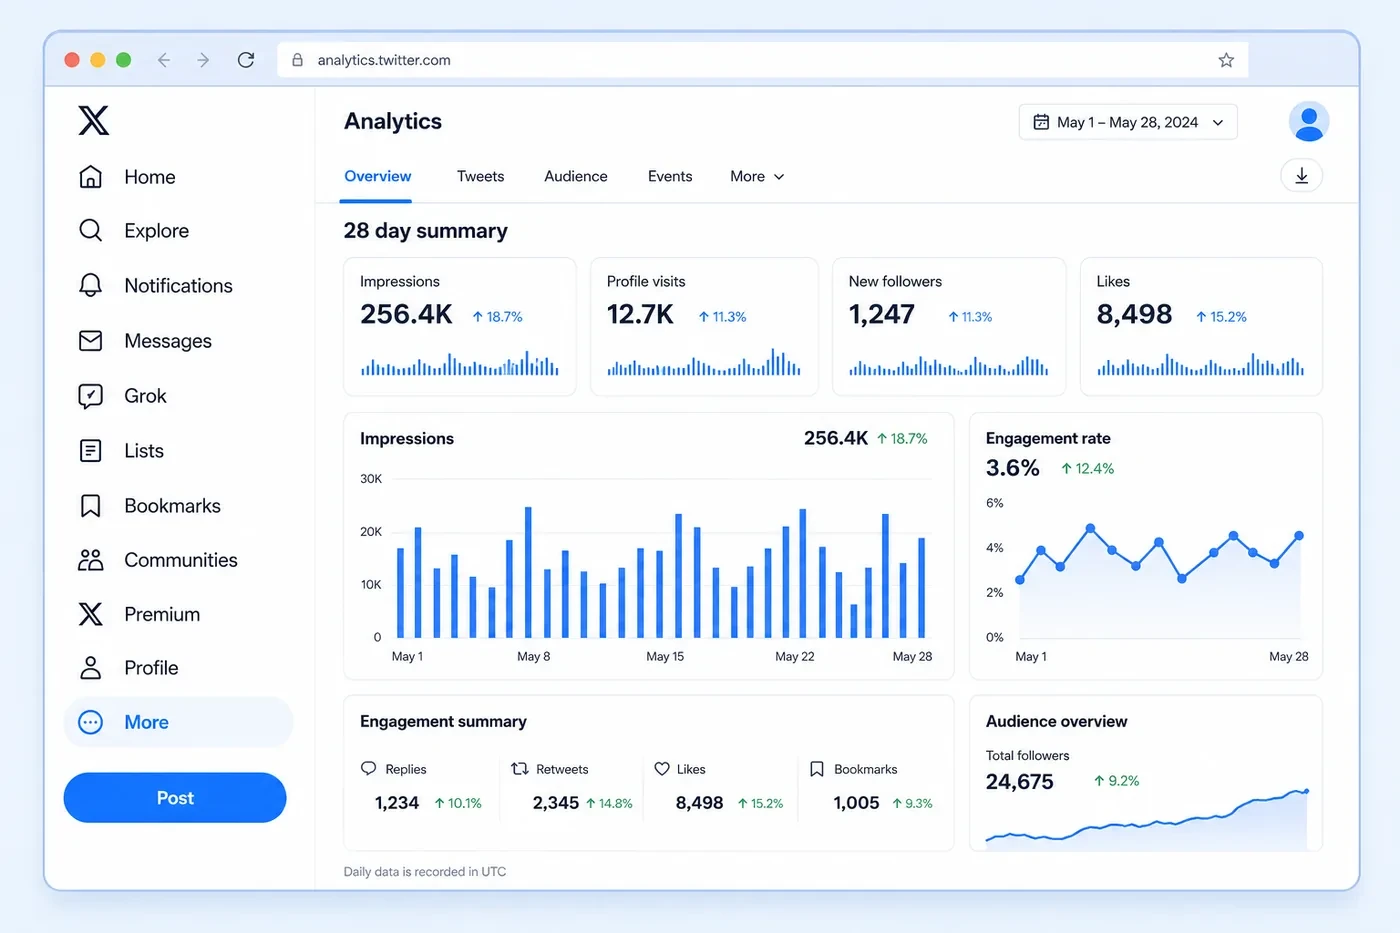
Open your browser and go to analytics.twitter.com. You can also access it from the left sidebar on x.com: click ‘More’ (the three-dot icon or the ‘More’ label), then look for ‘Creator Studio’ and click ‘Analytics’ inside it. You must be logged in to an X Premium account.
Step 2 Check the date range
The dashboard defaults to the last 28 days. You can adjust this by clicking the date picker in the top right. Shorter ranges (7 days) are useful for checking the impact of a specific campaign or content type. Longer ranges show you trajectory.
Step 3 Read the account overview
The home view shows your total impressions, profile visits, mentions, and new followers for the period. Each metric has a percentage change compared to the previous period, this context is more useful than the raw number alone.
Step 4 Click into individual tweets
Scroll down to see your top tweets ranked by engagement. Click any tweet to see its full breakdown: impressions, engagements, detail expands, link clicks, profile clicks, follows from this tweet, and more.
Step 5 Export your data (optional)
To export tweet activity as a CSV: from the dashboard, click ‘Export data’. You can export up to 90 days of tweet-level data, which you can then open in Excel or Google Sheets for deeper analysis.
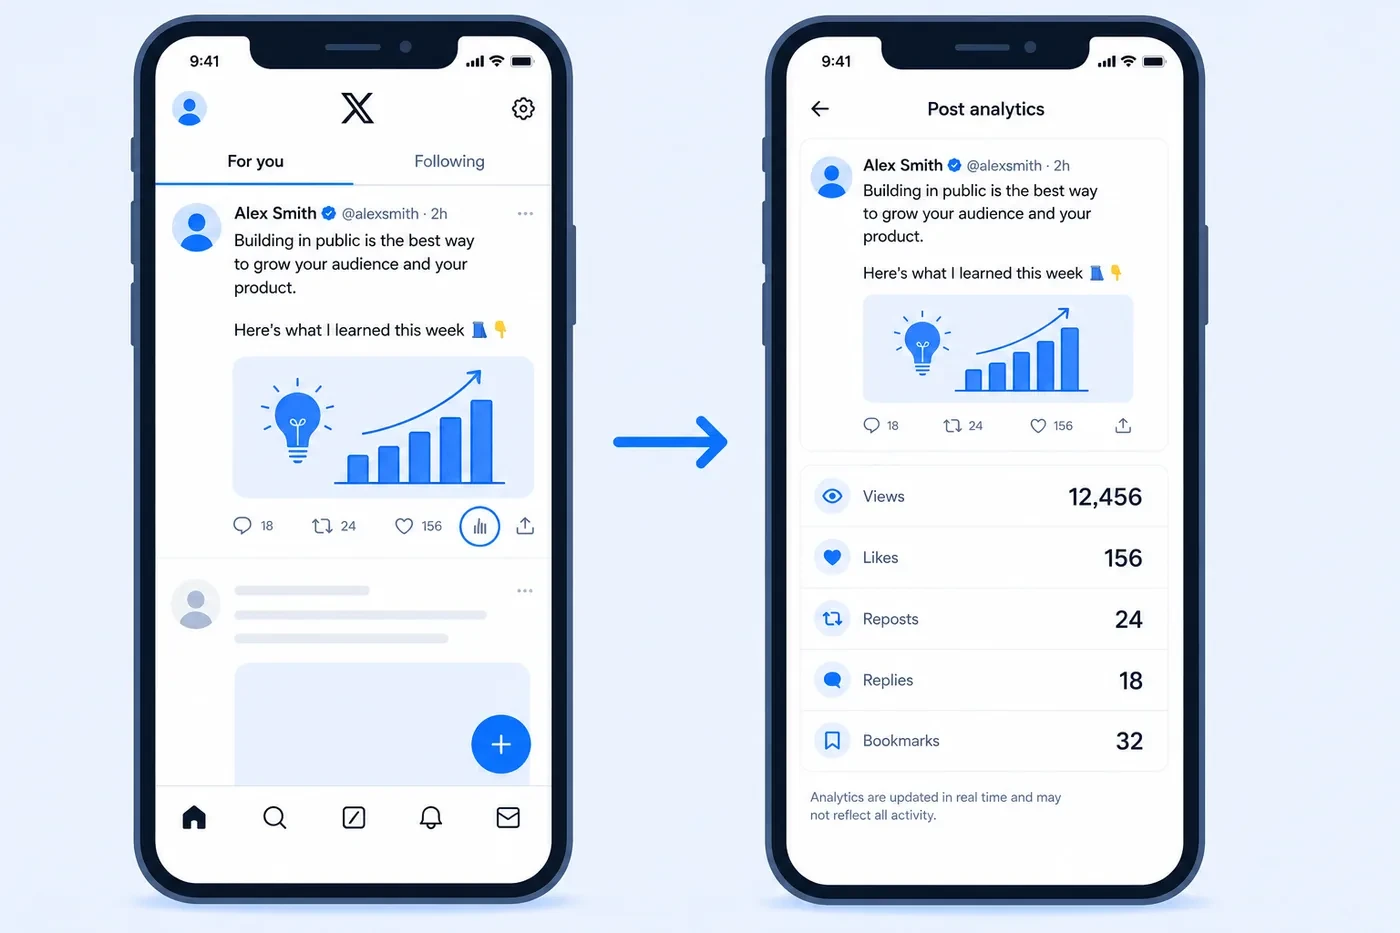
Option B: Per-Post Stats on Mobile (Free for All Users)
Even without Premium, you can see basic stats on each individual tweet from the mobile app. This gives you views, likes, reposts, replies, and bookmarks per post.
Step 1 Open the Twitter app and find any of your tweets
Step 2 Tap the bar chart icon below the tweet
On any tweet you posted, you will see a small bar chart icon in the row of action buttons beneath it (next to reply, retweet, and like). Tap it. This opens the post analytics for that specific tweet.
Step 3 Read your post metrics
You will see: impressions (total views), engagements (total interactions), profile visits from this tweet, and a breakdown of the types of engagement (likes, reposts, replies, link clicks, bookmarks). This is free regardless of account type.
Pro tip: The mobile per-post view is most useful for checking your recent tweets quickly. If you notice one post has significantly more profile visits than usual, that is a strong signal - people were interested enough to look at who you are, not just engage with the tweet itself.
Option C: Xholic AI (Free Analytics Without Premium)
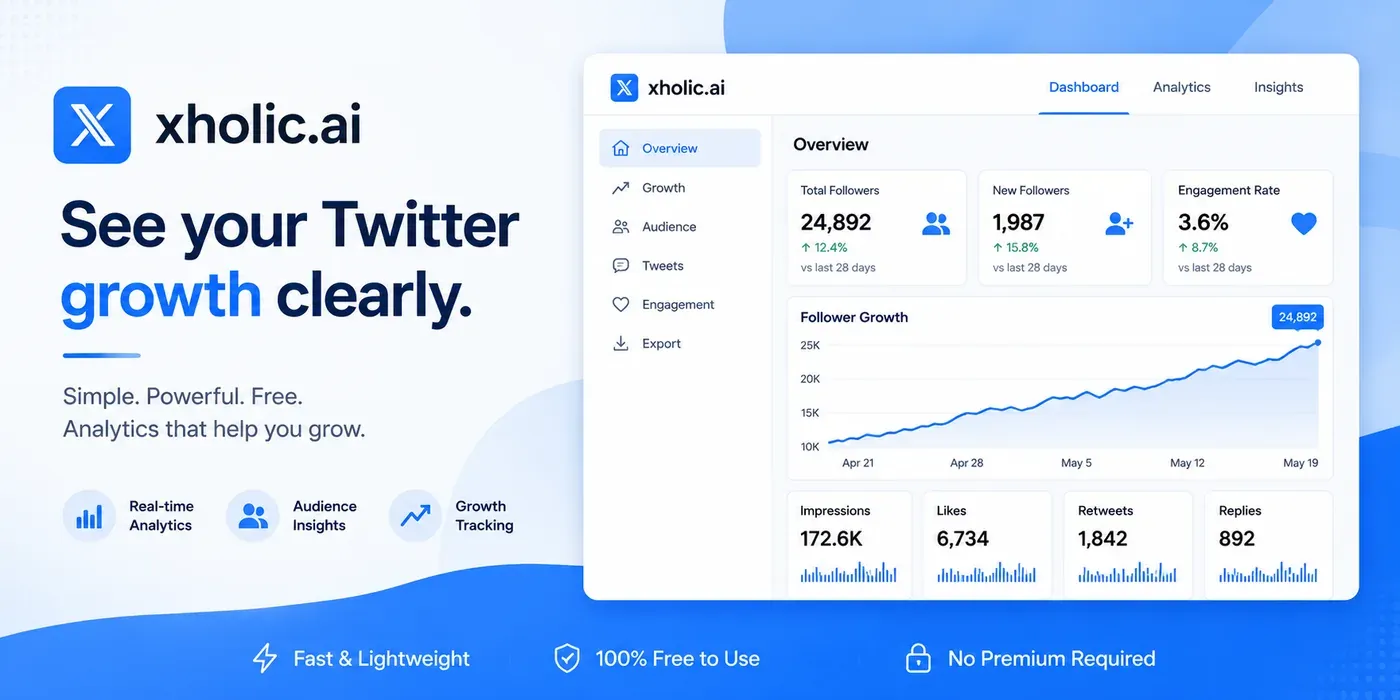
If you want account-level analytics, follower growth trends, engagement tracking across multiple posts, and performance insights over time, without paying for X Premium, Xholic AI’s Chrome extension is the most direct solution. It works inside your existing Twitter interface, requires no separate login, and shows you the analytics layer directly as you browse.
This is especially useful for tracking whether changes you make, like a new handle, a new content strategy, or a campaign push, are actually moving your numbers. See our guide on how to use Xholic AI for Twitter analytics for setup instructions.
Every Twitter Analytics Metric Explained (Plain English)
Twitter’s dashboard uses terminology that sounds intuitive but often means something specific that is worth understanding precisely. Here is every major metric with a plain-English explanation and what to actually do with the information.
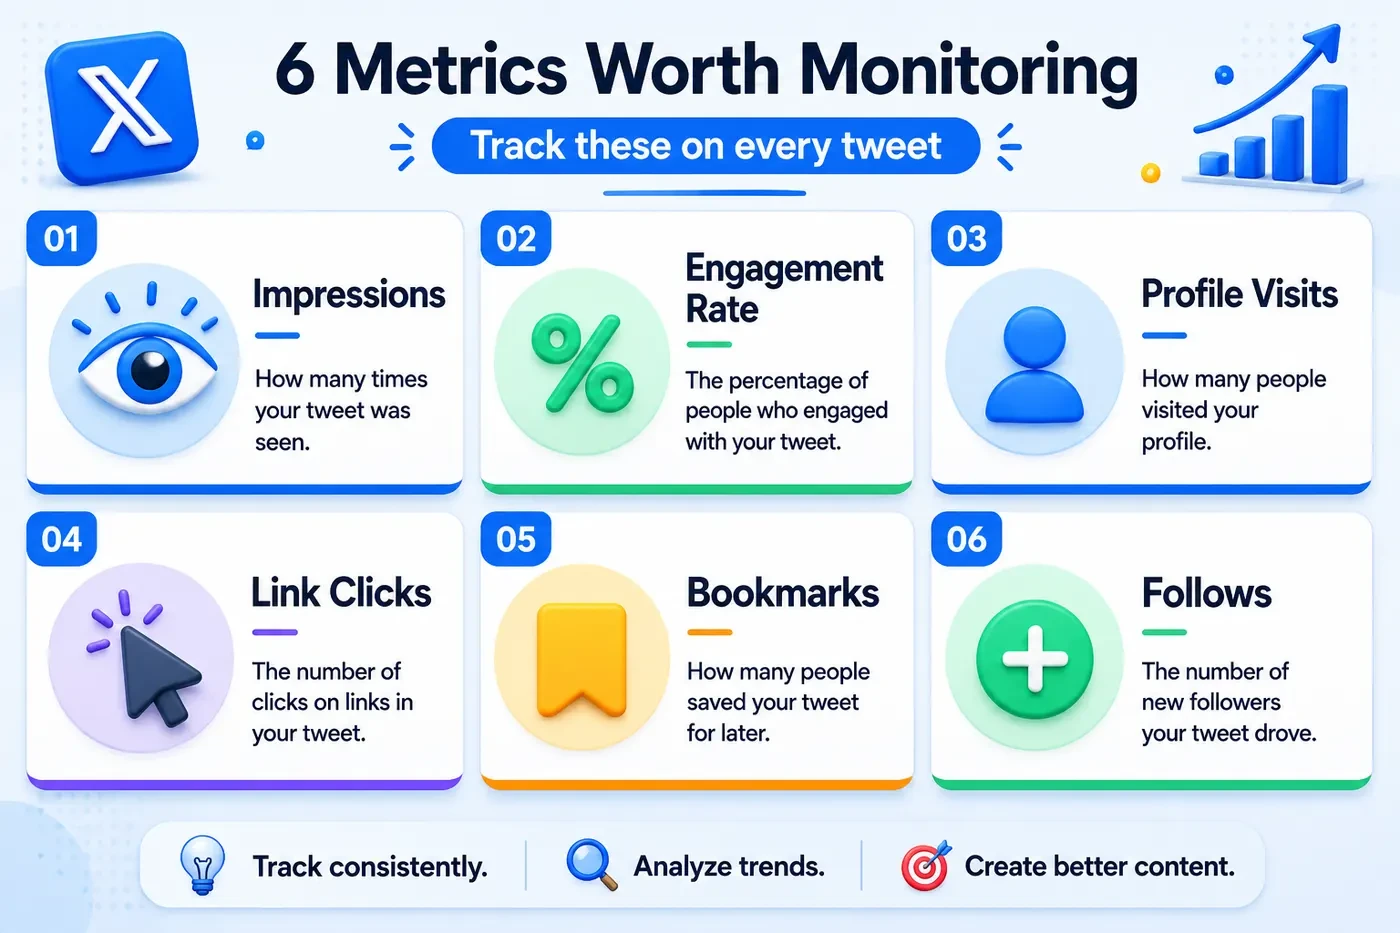
Impressions
Impressions are the total number of times your tweet appeared in someone’s feed, search results, or profile page, whether or not they looked at it, clicked it, or did anything at all. It counts every single display.
What it tells you: your reach. A tweet with high impressions but low engagement is being seen but not resonating. A tweet with low impressions but high engagement rate is connecting with a small but interested audience. Neither is inherently bad, context matters.
Heads up: Impressions are not the same as reach. Twitter does not publish a ‘reach’ metric for organic posts. Impressions counts every time the tweet was displayed, including if the same person sees it multiple times. Two people seeing your tweet once each = 2 impressions. One person seeing it twice = also 2 impressions.
Engagement Rate
Engagement rate is the percentage of people who saw your tweet and did something with it, liked, retweeted, replied, clicked, bookmarked, or expanded it.
Formula: Engagement Rate = (Total Engagements / Impressions) x 100
Example: if your tweet got 2,000 impressions and 60 total engagements (likes + replies + retweets + clicks), your engagement rate is 3%.
Key insight: Benchmark: The median engagement rate for brand accounts on X in 2025 was 0.029% (Rival IQ benchmark report). Creators and personal brands typically see 1.5-3%. If you are consistently above 1%, you are performing well. If you are below 0.5%, your content is reaching people but not connecting.
Profile Visits
Profile visits count how many people clicked through to your profile page after seeing a tweet. This is one of the most underrated metrics in the dashboard.
A high profile visit count on a specific tweet means people wanted to know more about you, they were curious enough to investigate. These are often your best-performing tweets in terms of intent, even if the raw engagement numbers are not the highest. Tweets that drive a lot of profile visits are the ones worth studying and replicating.
Follows
The ‘follows’ metric on individual tweets shows how many new followers came directly from that tweet. Twitter attributes these follows to the post that was being viewed when someone tapped Follow.
This metric is gold for understanding what content brings in new followers vs. what content satisfies existing ones. A tweet with 20 new follows is very different from a tweet with 400 likes but 0 new follows, both have value, but for different reasons.
Link Clicks
Link clicks count how many people tapped or clicked a URL inside your tweet. This is the most direct measure of traffic driven, if you linked to a blog post, a product, or a tool, this tells you how many people actually clicked through.
Link clicks combined with your website analytics give you a complete picture of Twitter-to-site traffic. If you are linking to your Xholic tools or guides, this is the metric that tells you whether Twitter is actually driving visitors.
Detail Expands
A detail expand happens when someone clicks ‘Show more’ or taps on the tweet to open it in full, without necessarily liking, retweeting, or clicking a link. It means they were interested enough to read more carefully, even if they did not take further action.
High detail expands on a tweet often indicate strong curiosity, your hook worked, people wanted to read the full thing. If a tweet has many detail expands but few likes or retweets, the content was interesting but may not have felt shareable or worth bookmarking.
Bookmarks
Bookmarks are a relatively newer metric showing how many people saved your tweet to their private bookmarks list. Bookmarks are almost always a signal of genuinely useful content, people save things they want to come back to, not things that just entertained them in the moment.
Pro tip: A high bookmark rate relative to likes often indicates your content is highly practical or informational. Threads with specific tips, tool recommendations, and how-to content typically perform best on bookmarks. If you are building a resource-driven brand, bookmark rate is one of your most meaningful metrics.
Video Views and Completion Rate
For tweets with video, Twitter shows total video views and completion rate. Views counts anyone who watched at least 2 seconds. Completion rate shows the percentage of viewers who watched to the end.
A high view count but low completion rate means people started watching but dropped off early, usually a signal that the first 3 seconds did not deliver on the promise, or the video ran too long. A high completion rate means the content held attention all the way through, which is genuinely rare and worth doubling down on.
How to Calculate Your Twitter Engagement Rate (and What It Means)
Twitter’s dashboard shows engagement rate automatically, but understanding how it is calculated helps you interpret it honestly, and stops you from gaming it in ways that make the number look good without actually mattering.
The standard formula
Engagement Rate = (Total Engagements / Impressions) x 100
Total Engagements includes: likes, retweets, quote tweets, replies, link clicks, profile clicks, detail expands, media clicks, and follows. Twitter counts all of these together.
What counts as a ‘good’ engagement rate on Twitter in 2026
| Engagement Rate | What It Means | Who Typically Achieves This |
|---|---|---|
| Below 0.1% | Content is reaching people but not connecting. Revisit your topics, tone, or hook. | Large brand accounts, passive posting |
| 0.1% - 0.5% | Average. Acceptable but leaves significant room to improve. | Most regular brand and creator accounts |
| 0.5% - 1% | Good. Your content is resonating. Keep testing to push higher. | Active creators, engaged niche accounts |
| 1% - 3% | Strong. You understand your audience well. Focus on consistency. | Engaged personal brands, niche experts |
| 3%+ | Excellent. Rare for accounts with large followings. Your content is genuinely connecting. | Small tight-knit niche accounts, viral posts |
Key insight: Engagement rate typically decreases as follower count increases. An account with 500 followers that posts niche content for a highly engaged audience will almost always outperform an account with 500,000 followers on engagement rate alone. This is normal and expected - do not use it as a direct comparison across accounts of different sizes.
The engagement rate mistake most people make
The most common mistake is optimising for engagement rate on its own without connecting it to your actual goal. If your goal is driving traffic to a product or blog, what matters is link click rate, not just total engagement. A tweet with 500 likes but 2 link clicks is a vanity win. A tweet with 50 likes but 85 link clicks achieved something real.
Match the metric to the goal:
- Goal: grow followers -> watch profile visits and follows per tweet
- Goal: drive website traffic -> watch link clicks
- Goal: build authority and trust -> watch bookmarks and detail expands
- Goal: build reach and awareness -> watch impressions and retweet rate
- Goal: start conversations -> watch reply rate relative to impressions
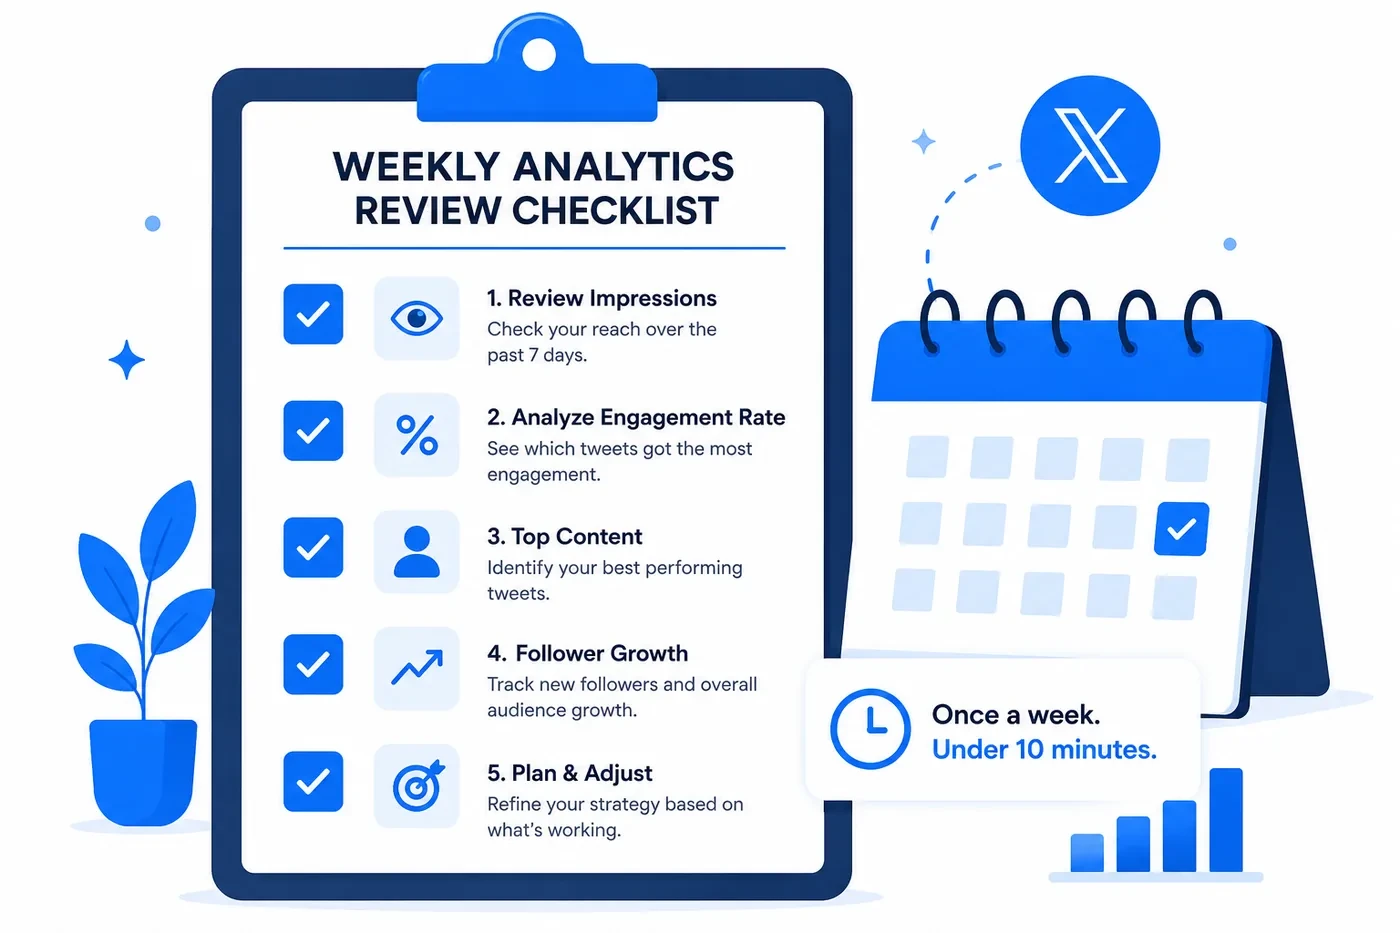
How to Actually Read Your Twitter Dashboard (What to Look for First)
Most people open their analytics, look at the numbers, feel vaguely good or bad about them, and close the tab. Here is a more structured way to get genuine insight out of the data in under ten minutes.
The 5-step analytics review (do this once a week)
- Check your 28-day trend, not just the number. The top of the dashboard shows total impressions, profile visits, and mentions. What matters is not the raw number, it is the percentage change from the previous period. Is the arrow pointing up or down? By how much?
- Find your top 3 tweets by engagement. Scroll to the tweet list and sort by engagement. What do the top 3 have in common? Are they a specific format (thread, image, opinion, how-to)? A specific topic? A specific posting time? This pattern is your repeatable edge.
- Find your bottom 3 tweets. Just as important. What did the low performers share? Same format that bombed before? A topic your audience does not care about? A time slot that consistently underperforms?
- Check your follower trend. Are you gaining more than you are losing? If follower count is flat or declining despite regular posting, the content strategy needs revisiting. Use a follower tracker tool to see day-by-day changes with more granularity than the native dashboard shows.
- Note one thing to test next week. Good analytics review always ends with a decision, not just an observation. It can be small; try posting at a different time, test a different hook format, try a thread instead of a single tweet. One deliberate test per week compounds quickly.
Reading your monthly trend: what the numbers are really telling you
| What You See | What It Actually Means | What to Do |
|---|---|---|
| Impressions up, engagement rate down | You’re reaching more people but connecting with fewer. Reach grew, resonance didn’t. | Audit your recent content - are you drifting from your core topic or audience? |
| Impressions flat, engagement rate up | Your content is getting better but not reaching new people. | Focus on strategies that extend reach: hashtags, reply threads, collaborations. |
| Both up | Healthy growth. Audience is growing and engaging. | Double down. Find what changed and do more of it. |
| Follower growth flat despite high engagement | Your engaged audience is loyal but you’re not reaching new people. | Increase retweet-worthy content and content that appears in ‘For You’ feeds. |
| High profile visits, low follows | People are curious but your profile isn’t converting them. | Revisit your bio, pinned tweet, and profile photo. |
Free Twitter Analytics Tools (If You Don’t Want to Pay for Premium)
X Premium gives you the native dashboard, but it is not the only way to get meaningful Twitter analytics. These tools fill different gaps in what native analytics cannot or no longer provides for free.
Xholic AI
Xholic AI is a Chrome extension built specifically for Twitter power users who want analytics without leaving the platform. It surfaces follower trends, engagement data, and per-post performance directly inside the Twitter interface, no separate dashboard, no Premium subscription required. For most creators and small brand accounts, it covers the analytics gap that X Premium locks away. Get Xholic AI free here.
Twitter’s own mobile per-post stats (free)
As covered earlier in this guide, the mobile app still shows per-post analytics to all users for free, views, likes, reposts, replies, bookmarks, and link clicks per tweet. It does not give you account-level trends, but it is a solid starting point for understanding your content performance tweet by tweet.
SocialBlade
SocialBlade tracks follower count history for any public Twitter account and displays simple growth charts, no login required. Useful for a quick check on your own growth trajectory or for benchmarking against a competitor or peer account.
Twitonomy
Twitonomy’s free tier offers deeper profile analytics including follower/following history, top content analysis, and basic audience data. It does require account connection. The free plan is limited in how many records you can pull, but it is more than enough for a one-time audit.
See the full breakdown of these and more options in our guide: Twitter Follower Tracker: 7 Best Free Tools in 2026.
5 Twitter Analytics Mistakes That Keep People Stuck
These are the patterns that show up again and again when people dig into their data the wrong way.
1. Optimising for impressions instead of engagement
Impressions are easy to chase and hard to convert. A tweet that lands on 50,000 timelines and triggers nothing is worth less than one that reaches 2,000 people and makes 80 of them click through to your site, follow you, or save it. Stop reporting impressions as success unless your actual goal is awareness at scale.
2. Checking analytics daily instead of weekly
Day-to-day fluctuations in impressions and engagement are mostly noise. Algorithms have good days and bad days, timing varies, and not every tweet is meant to perform equally. Weekly or bi-weekly reviews give you genuine signal. Daily checks create anxiety without insight.
3. Not connecting analytics to content decisions
Analytics without action is decoration. If your data consistently shows that how-to content gets 3x the engagement of opinion tweets, but you keep posting opinion tweets because they feel good to write, the data is pointless. The discipline is taking what the data shows and changing your approach accordingly, even when the finding is uncomfortable.
4. Ignoring the ‘follows per tweet’ metric
This is the most underused number in the dashboard. Which tweets are actually bringing in new followers? If you can identify two or three formats that consistently drive follows, those are your franchise content types. Build more of them deliberately rather than posting a wide variety and hoping something works.
5. Using engagement rate to compare yourself to large accounts
An account with 200,000 followers will almost always have a lower engagement rate than an account with 2,000 followers in a tight niche. This is structural, not a reflection of content quality. Compare your own engagement rate over time, or compare to accounts in a similar follower range. Cross-size comparisons are almost always misleading.
Twitter Analytics: Frequently Asked Questions
These answers are written to directly address the questions that appear in Google’s People Also Ask boxes, AI Overviews, and voice search results for Twitter analytics topics in 2026.
Is Twitter analytics free in 2026?
Partially. Per-post analytics (views, likes, reposts, replies, bookmarks per tweet) remain free for all users on the mobile app. The full account-level analytics dashboard, which includes follower growth trends, 28-day impressions overview, and top tweet rankings, now requires X Premium, which starts at $8 per month. Third-party tools like Xholic AI provide free account analytics without requiring X Premium.
How do I access Twitter analytics?
On desktop with X Premium: go to analytics.twitter.com or click More in the left sidebar -> Creator Studio -> Analytics. On mobile (free): tap the bar chart icon below any of your own tweets to see per-post stats. For free account-level analytics without Premium, use a third-party tool like Xholic AI, which surfaces data directly inside your Twitter interface.
What is a good engagement rate on Twitter?
A good engagement rate on Twitter in 2026 depends on account size. The median engagement rate for brand accounts is around 0.029%, according to Rival IQ’s benchmarks. Creator and personal brand accounts typically see 1-3%. Anything consistently above 1% indicates strong audience connection. Engagement rate naturally decreases as follower count grows, so always compare yourself to accounts in a similar follower range.
What is the difference between impressions and reach on Twitter?
Twitter does not publish a ‘reach’ metric for organic posts. Impressions count every time your tweet was displayed, including multiple views by the same person. Reach would count unique viewers. Since Twitter only shows impressions, a single person viewing your tweet five times would contribute 5 to your impression count. This is worth remembering when interpreting high impression numbers.
Can I see Twitter analytics for someone else’s account?
You can see public metrics on any account’s tweets, likes, retweets, replies, and view counts are visible publicly. However, you cannot see another account’s full analytics: their impressions, engagement rate, profile visits, or follower trend data. These are only visible to the account owner. Third-party tools like SocialBlade can show basic follower count history for public accounts.
How far back does Twitter analytics go?
The native analytics dashboard shows data easily for the last 28 days and allows custom date ranges. You can export tweet activity as CSV for up to 90 days. For data beyond 90 days, you need a third-party archiving tool. Twitter does not provide an official way to access analytics older than 90 days from the native dashboard.
Does Twitter analytics show who viewed my tweets?
No. Twitter analytics shows aggregate view counts (impressions) but does not reveal which specific accounts viewed your tweets. You can see total impressions, engagement counts, and profile visits, but never the identities of individual viewers. This applies to both free and Premium accounts.
What happened to Twitter analytics after the rebrand to X?
The core analytics functionality has remained largely intact since the X rebrand. The main change affecting users is access: the full account dashboard moved behind the X Premium paywall, whereas it was previously free. The URL analytics.twitter.com still works and redirects correctly. The metrics tracked and the dashboard layout are largely the same as the pre-rebrand Twitter Analytics.
Why are my Twitter analytics not loading?
If your analytics dashboard is not loading, try these steps: clear your browser cache and reload, check that you are logged in to an X Premium account (required for the full dashboard), try a different browser, or check X’s status page at status.x.com for known outages. Mobile per-post analytics occasionally show delayed data, refresh the app or check back after a few minutes.
How do I improve my Twitter engagement rate?
The most consistent ways to improve engagement rate on Twitter are: post content that prompts a response (questions, polls, bold opinions), write stronger tweet hooks (the first line determines whether anyone reads the rest), post at times when your audience is active, and consistently stay in a clear niche rather than posting broadly. Use your analytics to identify which content formats generate the most engagement for your specific audience, then produce more of them deliberately.
Related Guides
Analytics tells you what is working. These guides help you act on it:
- Twitter Follower Tracker: 7 Best Free Tools in 2026 - track your follower growth with more granularity than the native dashboard provides
- How to Change Your Twitter Handle (Without Losing Followers) - if your profile analytics show low conversion, a cleaner handle is one of the easiest fixes
- How to Make a Viral Tweet in 2026 - use your engagement data to identify the formats worth replicating
- How to Write a Twitter Bio That Gets You Followers - high profile visits but low follows usually means your bio is not converting
- Fake Tweet Generator - mock up different tweet formats and hooks before posting to test how they look
Putting It All Together
Twitter analytics is only useful if you act on it. The dashboard, the metrics, the benchmarks, none of it matters if you check the numbers and change nothing.
Start simple: look at your top three and bottom three tweets from the past 28 days. Find one pattern in each. That pattern is your first data point. Over four weeks of consistent review, you will have enough signal to know what your audience actually responds to, not what you guess they want, not what performs well for someone else’s account, but what works for yours specifically.
If you are hitting the limits of what free native analytics shows you, Xholic AI fills the gap without requiring X Premium. Install the Chrome extension, connect it to your Twitter account, and you will have follower trend data and engagement insights running in the background every time you open Twitter.
Build a Weekly Twitter Analytics Reporting System
A useful dashboard review should end with a decision, not a screenshot folder. Use the same short reporting rhythm every week:
- Record total impressions, engagements, profile visits, and follows for the period.
- Separate original posts from replies so one format does not hide the performance of the other.
- List the three posts that created the most qualified replies, profile visits, or follows.
- Note the hook, topic, format, and posting window shared by those posts.
- Choose one pattern to repeat and one weak pattern to stop testing next week.
Keep the calculation method and reporting window consistent. A weekly median across recent original posts is usually more useful than one viral outlier, and it makes trend changes easier to diagnose.