To find the average twitter engagement rate, the most common advice will push you toward one number. That’s the wrong move. On X (Twitter), the “average” changes based on follower size, industry, and the formula used to calculate engagement. A benchmark that looks healthy for a small account can be weak for a larger one, and a per-follower rate doesn’t mean the same thing as a per-impression rate. The better question is simpler and more useful: what benchmark fits your account size, your content type, and the engagement actions that help you grow?
Why ‘Average Engagement Rate’ Is the Wrong Metric
Searching for the average Twitter engagement rate leads to a mess of conflicting numbers because there is no single average that means much on its own.
Different benchmark studies use different formulas, different account sets, and different definitions of engagement. Some count likes, replies, and reposts against followers. Others use impressions and include clicks, video views, or profile visits. Put those into one pile and the result looks precise, but it is not useful for decision-making.
The bigger problem is context. A small expert account with a tight audience can post to 3,000 followers and generate strong reply activity. A large publisher with hundreds of thousands of followers may earn a lower engagement rate while still reaching far more people. Calling one number “average” hides the difference between audience size, content model, and distribution pattern.
That is why I do not use a platform-wide average as a performance target.
I use it, at most, as rough orientation. This benchmark starts with follower tier, then moves to engagement type. A like is a weak signal. A repost can help distribution. A thoughtful reply usually tells you much more about content-market fit, audience quality, and whether a post is likely to create downstream reach.
This is the mistake I see in reporting. Teams chase a rate that looks healthy on a dashboard, even when the engagement mix is poor. If the post gets lightweight likes but no replies, no profile clicks, and no reposts from relevant accounts, the number can look fine while growth stalls.
A better question is simple: compared with accounts of similar size, are you generating the kinds of engagement that expand reach and strengthen audience relationship?
If you want cleaner reporting, start with a proper Twitter analytics workflow and define your benchmark by follower tier and engagement quality before you judge whether a rate is “good.”
How to Calculate Your X Engagement Rate Correctly
A lot of confusion around average twitter engagement rate starts with bad math. Two people can look at the same tweet, use different formulas, and report very different results. Both numbers can be technically correct.
Use one formula consistently
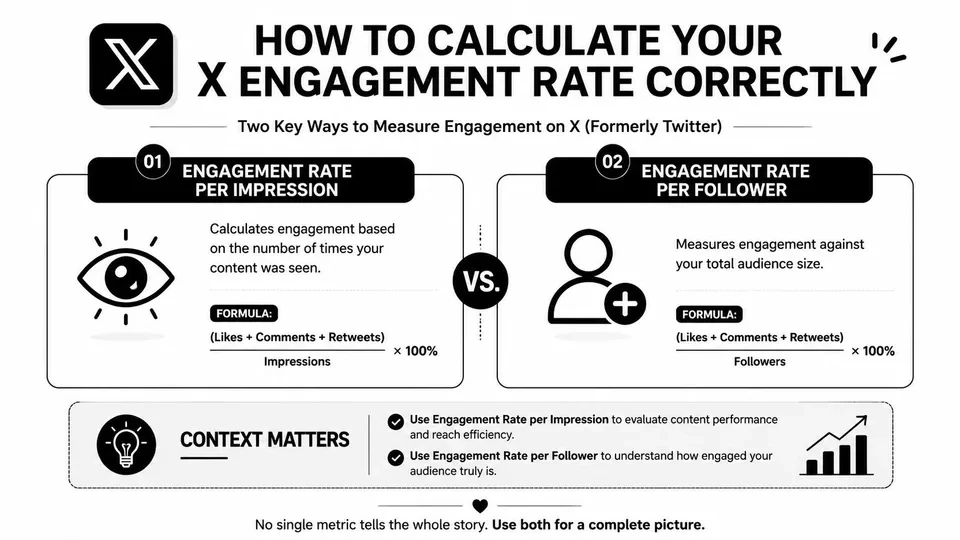
TweetArchivist’s benchmark guide notes that Rival IQ uses engagement rate per follower as [likes + retweets + replies] / followers, while Social Status recommends an impressions-based formula that can include replies, video views, URL clicks, profile clicks, and hashtag clicks divided by impressions. The formula you choose changes the story you’re telling.
Use these two methods for different jobs:
| Method | Formula | Best use |
|---|---|---|
| Per follower | (likes + retweets + replies) / followers | Comparing account-level performance against audience size |
| Per impression | (total chosen engagements / impressions) x 100 | Judging how well a post performed after people actually saw it |
Here’s a simple way to understand:
- Per follower tells you how active your audience is relative to your total account size.
- Per impression tells you how compelling the post was once it entered the feed.
If you’re reporting to a client or team, pick one primary formula and stick to it for a defined time window. Don’t switch formulas from week to week because one version looks better.
Use the same formula, the same audience size band, and the same time window before you call a post underperforming.
A cleaner setup helps. A dedicated Twitter analytics dashboard makes it easier to separate account health from post efficiency instead of blending them into one vague “engagement” number.
What should count as engagement
Many creators undercount what matters here.
Likes are the easiest signal to notice, but they’re often the least useful if your goal is growth. For X, deeper actions usually tell you more:
- Replies show conversation value and can extend visibility.
- Retweets and quote posts show distribution.
- Profile clicks often indicate curiosity about the person behind the post.
- URL clicks matter when the tweet is supposed to move traffic.
- Detail expands and hashtag clicks can signal interest even when users don’t publicly engage.
A practical setup is to track two layers:
- Public engagement layer for likes, replies, retweets, and quote-post style distribution.
- Intent layer for profile visits, link clicks, and other actions that show stronger interest.
That split helps you avoid a common mistake. A tweet can look average in public engagement and still be strong if it drives the kind of actions you care about.
2026 Engagement Rate Benchmarks by Follower Size
A single platform average is a weak benchmark for X. It hides the one pattern that matters in practice: engagement rate usually drops as follower count rises, and the mix of engagement changes with it.
Buffer’s January 2025 cross-platform benchmark puts X at an average engagement rate of 2.31%. WebFX’s X benchmark summary gives a more useful layer for planning because it breaks expectations out by account size instead of treating every account as comparable.
Benchmark by follower tier, not by one blended average
| Follower tier | Working benchmark range |
|---|---|
| Under 5K followers | 2% to 5% |
| 500K+ followers | 0.2% to 1% |
Use these as calibration ranges, not universal targets.
Smaller accounts often post to a denser audience. More followers recognize the name, share the same niche context, and are willing to reply. That usually keeps engagement rates higher, especially when the account has a clear point of view.
Large accounts have a different problem. Reach expands faster than audience closeness. Posts get more passive impressions from people who scroll, maybe like, and move on. The engagement rate drops even when total engagement goes up.
That trade-off matters.
A post from a 3,000-follower founder that gets 20 thoughtful replies can be more useful for growth than a post from a 300,000-follower brand account with a low-signal pile of likes. Replies, reposts, and quote posts tend to create more distribution and better audience feedback than lightweight reactions alone.
What good performance actually looks like at each size
At the sub-5K level, I expect stronger interaction density. If the account is active in a clear niche, good posts should attract replies, back-and-forth discussion, and some profile curiosity. A rate in the benchmark range is helpful, but the better question is whether the engagement comes from the right people.
At larger sizes, rate compression is normal. The benchmark range drops because the denominator grows faster than meaningful interaction. That does not automatically mean the account is weak. It usually means the account needs stricter quality filters. Are replies coming from relevant people? Are quote posts extending the conversation? Are posts generating profile visits from users who match the target audience?
That is why follower context matters more than a blended average.
For account-level context, Twitter follower analytics by audience segment and quality helps you check whether your follower base is aligned with the topics you post about. If the audience is broad but low intent, even a decent headline engagement rate can hide weak growth potential.
The practical benchmark is simple. Compare your account against others with similar follower size, similar posting style, and a similar audience profile. Then look past the rate itself and inspect the engagement types that create momentum on X.
Key Factors That Influence Your Engagement Rate
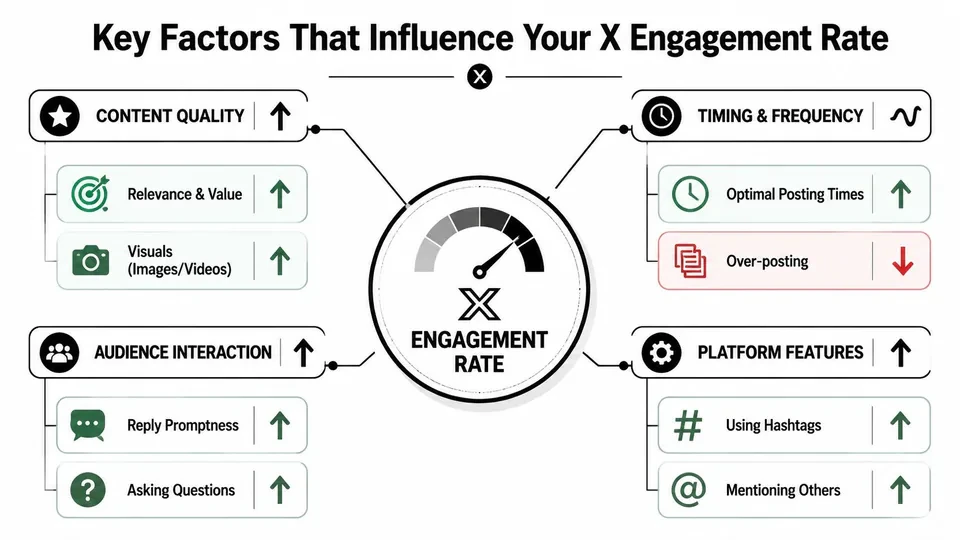
The biggest drivers of engagement on X aren’t mysterious. Most weak performance comes from a mismatch between the content, the audience, and the moment it was posted.
Niche changes the ceiling
Metricool’s X engagement benchmark cites a 0.029% median from Rival IQ for 2024 and shows how much niche affects results. In the same data, sports teams reached 0.072%, while media brands sat at 0.009%.
That’s a huge practical lesson. If you’re in a category where people naturally react in real time, your ceiling is different from a category where users mostly skim headlines and move on.
A few examples:
- Sports, finance, tech, and news-adjacent topics often benefit from immediacy.
- Broad media accounts can have large reach but weaker interaction quality.
- Founders building in public usually do better when they post a clear point of view instead of neutral updates.
If you don’t account for niche, you’ll misread your own ceiling and chase the wrong fixes.
Format timing and audience quality matter more than volume
Content format shifts how people interact. Some tweets invite a quick like. Others invite a reply, a profile click, or a quote post. Those aren’t equal outcomes.
The patterns I see most often are simple:
- Plain links without context usually underperform because they ask for a click before they earn attention.
- Strong text hooks work when the first line creates tension, specificity, or a clear opinion.
- Quote posts and threaded commentary tend to do better when the account adds a real point rather than repeating the original tweet.
- Visuals and short clips help when they clarify the point, not when they act as decoration.
Timing matters too, but not in the generic “post at the best hour” sense. On X, timing is often about joining a conversation while it still has momentum. A solid reply to a relevant post can outperform a standalone tweet because it enters an active thread instead of starting from zero.
Audience quality is the last multiplier. If your followers came from giveaways, shallow virality, or content outside your niche, they’ll inflate your denominator without helping your engagement rate. A smaller aligned audience is usually more useful than a larger indifferent one.
Actionable Tactics to Boost Your X Engagement
Most X growth advice still centers on posting more often and hoping something lands. That’s inefficient. A better approach is to improve the kinds of engagement that create visibility, conversation, and qualified attention.
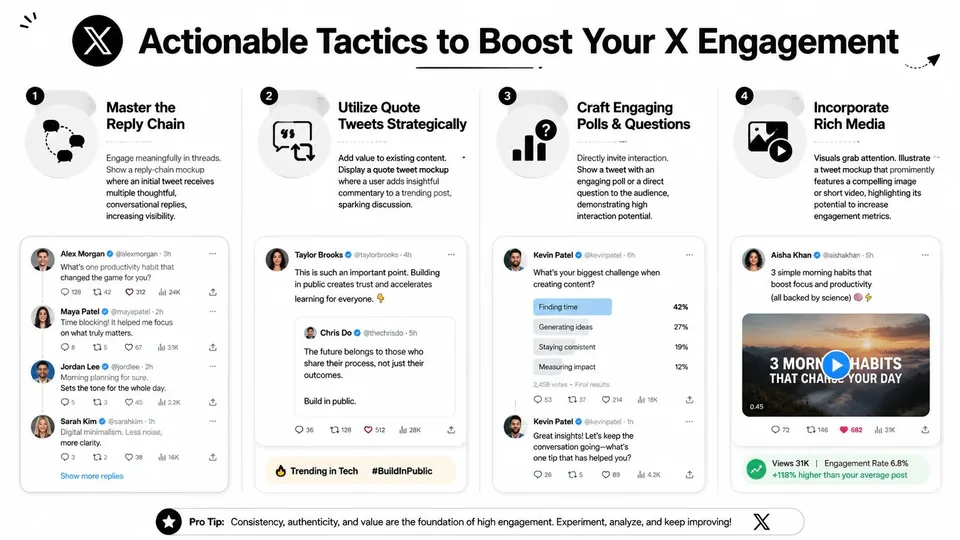
Build around replies not vanity likes
Adobe’s engagement guidance frames X as a platform built for real-time dialogue, and the benchmark summary tied to that guidance notes reply rates for promoted tweets are only 0.02% to 0.05%. That’s the clue. Replies are rarer, and because they’re rarer, they often matter more.
Start with a reply-first workflow:
-
Find active conversations early
Don’t reply to dead threads. Look for tweets that already have traction but still have room for discussion. -
Add a useful angle
The best replies do one of three things: clarify the original point, add a real example, or introduce a respectful counterpoint. -
Avoid filler agreement
”Totally agree” doesn’t travel. It doesn’t help the author, and it doesn’t give new readers a reason to click your profile. -
Write for the second reader
Your reply isn’t only for the original poster. It’s for everyone else scanning the thread.
A simple reply template:
Try this: “Strong point. The part most people miss is [specific nuance]. In practice, this matters because [practical consequence].”
That format works because it adds substance without trying to hijack the conversation.
For teams that want a repeatable workflow, one option is Xholic AI’s 2026 engagement playbook. The toolkit itself is built around discovering high-momentum tweets, generating context-aware replies, remixing proven post structures, organizing saved posts, and scheduling drafts with Smart Scheduling.
Later in the workflow, visual planning can help too. If you’re testing how a response thread or campaign concept will look before it goes live, a quote tweet mockup tool or a reply chain mockup generator can help teams review copy, sequencing, and tone. These mockups are useful for planning, presentations, and approvals, and they shouldn’t be used to mislead people.
A quick walkthrough helps if you’re building a system around replies and post quality:
Use better post structures and a tighter workflow
Good engagement on X usually comes from post construction, not luck. These tactics consistently help:
-
Open with a real hook
Start with a claim, observation, or tension point that makes the right reader stop. “Most founders post updates. Buyers react to conclusions” is stronger than “A few thoughts on building in public.” -
Use quote posts selectively
Quote posts work when you add interpretation, not when you echo the original tweet. If your comment could have been a like, it probably shouldn’t be a quote post. -
Ask narrower questions
Broad prompts invite low-effort responses. A tighter question gives people an easier entry point.
Example tweet:
“What changed your X growth more this year: better hooks, better replies, or better timing? One answer only.” -
Turn one idea into multiple formats
A strong idea can become a standalone tweet, a thread opener, a quote post, and several replies. That raises output quality without forcing you to invent from zero every day. -
Schedule once the draft is ready, not before
Consistency matters, but forced publishing usually produces flat content. Draft when the idea is sharp, then queue it for the next strong posting window.
If you need visual assets for planning hooks or campaign drafts, the fake tweet generator can help mock up examples for review. Use it for product mockups, educational examples, or stakeholder approvals. Don’t use mockups to pass fiction off as real content.
Common Mistakes to Avoid When Tracking Engagement
The first mistake is comparing different formulas as if they’re interchangeable. If one report uses per-follower engagement and another uses impressions, the numbers won’t line up. The fix is boring but important. Pick one formula for the report and label it clearly.
The second mistake is overreacting to a single tweet. X is volatile. One post can get buried, another can catch a live conversation, and neither one alone tells you much about your system. Look for patterns across a batch of posts instead of treating one breakout or one flop as a strategy verdict.
Most engagement problems aren’t content problems alone. They’re measurement problems first.
The third mistake is rewarding the wrong action. Plenty of accounts optimize for likes because likes are visible and emotionally satisfying. But if growth comes from conversations, profile visits, and qualified clicks, then a highly liked post can still be strategically weak.
A few more errors show up often:
-
Ignoring audience mismatch
If your followers came in for one topic and you’re now posting another, lower engagement isn’t surprising. -
Publishing without previewing
Threads, quote posts, and campaign tweets often look fine in a draft doc but awkward in-feed. Previewing visual layout before posting can catch obvious issues. -
Buying followers or chasing empty reach
Inflating audience size usually hurts your engagement rate because the denominator grows faster than meaningful interaction.
Clean measurement makes content decisions easier. Sloppy measurement turns every post into a false signal.
Frequently Asked Questions About X Engagement
Is 1% a good engagement rate on X
It depends on the account size, niche, and formula. For some larger accounts, that can be solid. For smaller niche accounts, it may be ordinary. The useful comparison isn’t a universal average. It’s the benchmark that matches your follower tier and measurement method.
Should I track engagement daily or weekly
Check lightly each day if you’re actively posting and replying, but evaluate performance in grouped windows. Daily checks help you catch live opportunities and obvious misses. Weekly or multi-post reviews are better for deciding what formats, hooks, and reply styles work.
Why did my engagement suddenly drop
The common causes are simple. You changed topic, posted into weaker conversation windows, relied on formats your audience doesn’t respond to, or reached more passive viewers than usual. Start by checking whether impressions changed, whether replies dropped, and whether your recent posts still match follower intent.
Conclusion: From Chasing Averages to Driving Growth
The average twitter engagement rate isn’t one number you can copy into a spreadsheet and trust. On X, averages hide the parts that matter most: follower size, niche, formula, and engagement type.
A better approach is straightforward. Calculate your rate the same way every time. Compare it against a relevant follower-tier benchmark. Then focus on the signals that help accounts grow on X, especially strong replies, conversation quality, and posts that earn attention after the first impression.
If your content looks weak by a generic average, that doesn’t automatically mean the strategy is broken. It usually means the benchmark is too broad to be useful.
If you want a more systematic way to find high-momentum conversations, write stronger replies, organize saved ideas, remix proven tweet structures, and keep a consistent posting rhythm, try Xholic AI. It’s built for creators, founders, marketers, and power users who want an AI-powered X growth toolkit instead of a pile of disconnected tools.