A good Twitter engagement rate by followers in 2026 typically falls between 0.05% and 2%, depending on account size. Smaller accounts under 10K followers should expect higher percentages, usually 1% to 2% or more, while accounts above 100K followers often land closer to 0.05% to 0.3%.
That range looks broad because the denominator changes the story. A large 2026 benchmark of 34,895 X accounts with at least 948 followers found a median follower-based engagement rate of 0.079% per original post during the 30 days ending 1 September 2026, while the upper quartile began at 0.426% (Playersells’ engagement rate benchmarks). In other words, 0.4% can already be unusually strong for an established account, even though it may look modest beside the percentages smaller creators report.
What a Good Twitter Engagement Rate by Followers Looks Like in 2026
A practical answer to the question “what is a good Twitter engagement rate by followers?” is to benchmark against your account tier rather than use one platform-wide target.
| Account size | Practical 2026 range |
|---|---|
| Under 10K followers | 1% to 2%+ |
| 10K to 100K followers | About 0.25% to 1% |
| 100K+ followers | About 0.05% to 0.3% |
These ranges are directional, not universal laws. Independent 2026 benchmark frameworks show follower-based engagement declining as accounts grow, with median rates ranging from 2.18% for nano accounts with 1K to 10K followers to 0.35% for mega accounts with 500K or more followers (SociaVault’s 2026 X benchmark data). Another framework places strong performance at roughly 4%+ below 1,000 followers, 2% to 4% for 1,000 to 10,000, 1% to 2% for 10,000 to 100,000, and 0.5% to 1% above 100,000 (Sorsa’s engagement calculator benchmarks).
The formula behind the percentage
Engagement rate by followers is calculated as:
(likes + replies + reposts + quotes + selected clicks or bookmarks) ÷ followers × 100
The exact actions depend on the reporting system. The widely used follower-based version commonly includes likes, replies, reposts, quotes, and sometimes bookmarks or clicks (Quwitter’s X engagement rate benchmarks). For a plain-language explanation of the broader metric, this engagement rate definition is useful.
The follower denominator remains popular because it gives you a stable reference point across posts and reporting periods. However, it can mislead. A 0.5% rate on a 5K account may indicate a smaller, highly concentrated audience, while the same 0.5% on a 500K account can represent much broader absolute interaction and distribution potential.
The honest benchmark therefore has three parts: the denominator you chose, the follower tier you occupy, and the quality of the interactions behind the percentage.
How to Calculate Engagement Rate by Followers
Start with one post and list the interactions you want to count. A practical formula is:
Engagement rate = total included engagements ÷ follower count × 100
Suppose an account has 8,200 followers and one post receives 140 likes, 22 replies, 18 reposts, and 31 link clicks. The total is 211 engagements. Divide 211 by 8,200, which equals 0.0257, then multiply by 100. The result is 2.57%.
What belongs in the numerator
Include actions that show an active response to the post:
- Likes, which indicate lightweight positive reaction.
- Replies, which show that someone entered the conversation.
- Reposts and quote posts, which extend the content into another audience.
- Profile clicks, link clicks, or bookmarks, when your reporting definition includes them and you apply that definition consistently.
Leave passive exposure out of the numerator. Impressions, follower growth, and dwell time describe distribution or audience behavior, but they aren’t interchangeable with direct post interactions.
For a deeper walkthrough, use this guide to calculate Twitter engagement rate.
Use a time window, not one impressive post
Native X analytics can provide account and post-level information, including views, interactions, and related performance details. Check the available 28-day and 90-day views, then open the per-post detail panel for the individual inputs.
Don’t confuse a sum with an average. Adding every interaction across a period and dividing by the starting follower count produces a different result from averaging each post’s rate. Individual posts can also vary sharply, so a single viral post shouldn’t define your benchmark. For comparability, report a 30-day median where possible, matching the methodology used by the large benchmark cited earlier.
A simple spreadsheet is enough. Record the date, post URL, engagement total, follower count, and calculated rate. Over time, that record shows whether your engagement is improving, holding steady, or being diluted by follower growth.
Engagement Rate Benchmarks by Follower Tier
Follower-based engagement usually follows a decay curve. As an account gains followers, its denominator can grow faster than the number of people who actively like, reply, repost, or quote each post. A useful benchmark therefore needs both a follower tier and a clear denominator.
The table below is the article’s working synthesis of the tier patterns cited earlier. It is follower-based, not impression-based, so treat the ranges as comparison bands rather than universal targets.
| Follower tier | Follower range | Low rate | Median rate | High rate |
|---|---|---|---|---|
| Nano | Under 1K | 1.5% | 2% | 4% |
| Micro | 1K to 10K | 1% | 1.5% | 2% |
| Mid | 10K to 100K | 0.3% | 0.6% | 1% |
| Macro | 100K to 500K | 0.1% | 0.25% | 0.4% |
| Mega | 500K+ | 0.05% | 0.1% | 0.2% |
Published benchmarks do not produce one identical set of medians. Sociavault reports 2.18% for 1K to 10K, 1.42% for 10K to 50K, 0.97% for 50K to 100K, 0.63% for 100K to 500K, and 0.35% for 500K+ accounts (SociaVault’s follower-tier comparison). The difference from the table reflects variation in account samples, tier boundaries, and calculation methods. The consistent finding is directional: follower-based rates generally decline as audience size increases.
Why the rate compresses
Smaller accounts often have a concentrated audience built around a specific topic or relationship with the creator. Larger accounts usually include more casual followers, inactive accounts, and people who no longer follow the account’s current subject. The denominator expands, while the share of followers responding to any one post becomes harder to maintain.
Publishing style changes with scale too. A founder or creator may write conversational posts and answer nearly every reply. A larger account may publish broadcast-style updates that generate substantial reading but fewer visible responses. Its percentage can fall even when total interaction remains meaningful.
Niche fit still matters within every tier. A 50K fintech account and a 50K meme account can show different response patterns because their audiences have different reasons to interact. Compare accounts with similar follower counts, audience intent, and content format before judging whether your rate is strong. Pair the percentage with reply quality, repost relevance, and repeat participation to distinguish an active community from passive reach.
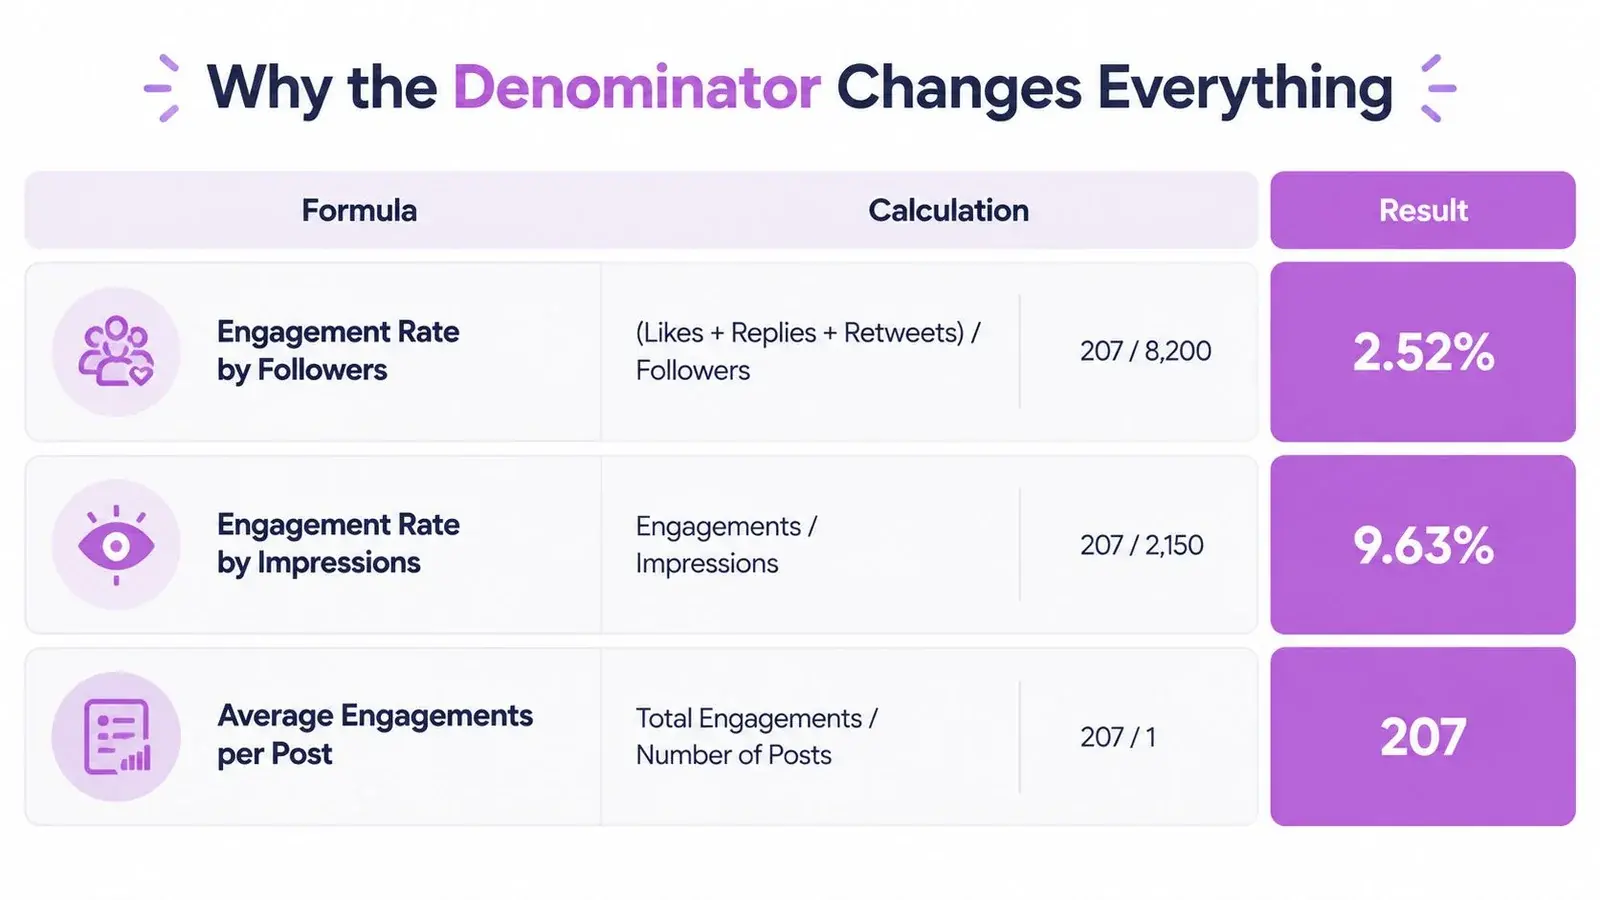
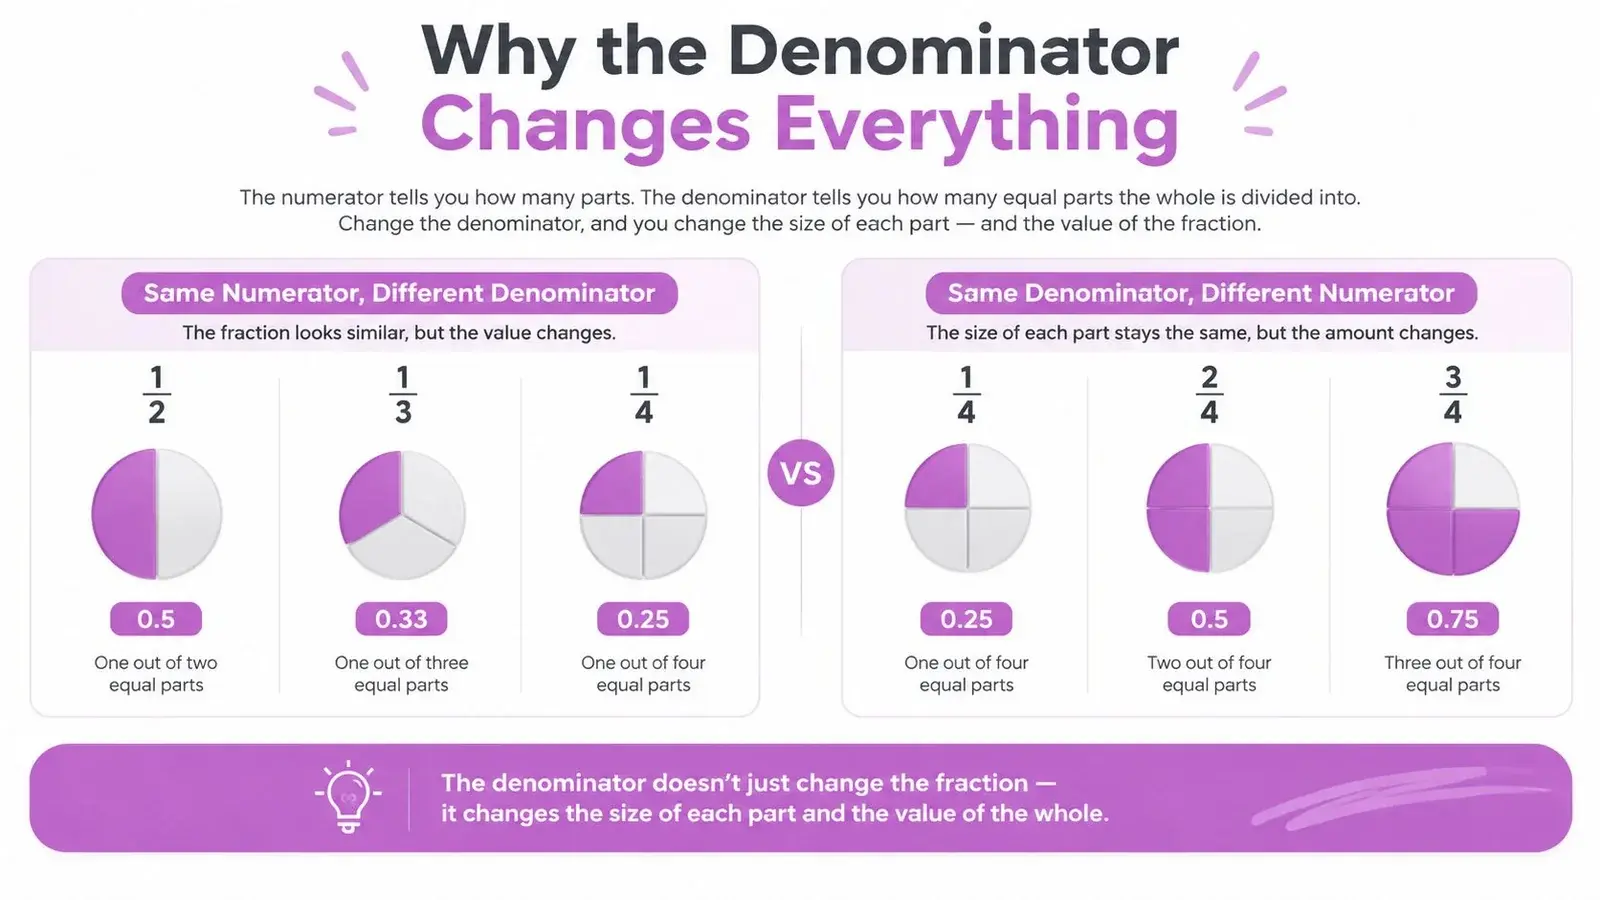
Why the Denominator Changes Everything
The same interaction total can produce very different readings depending on what you divide by.
| Formula | What it tells you |
|---|---|
| Engagements ÷ followers | How much of your follower base interacted |
| Engagements ÷ impressions | How well the content converted exposure into interaction |
| Total engagements ÷ posts | The average interaction volume per post |
The follower-based measure is useful for account comparisons because the denominator is relatively stable. It also makes small, focused accounts look efficient when a meaningful share of their audience participates. Its weakness is that it treats every follower as part of the potential audience, even when many followers don’t see a particular post.
The impression-based rate answers a different question. It measures interaction among people who were exposed, including non-followers when distribution extends beyond the follower graph. Verified benchmark sources place follower-based averages in ranges from roughly 0.015% to 0.045% up to about 0.10%, while impression-based figures are often around 1% to 3% (OnlineToolix’s comparison of X engagement formulas). Those figures shouldn’t be compared directly.
Average engagements per post adds volume, but it hides how often you publish. An account can increase its average by posting less frequently, while another can generate more total interactions through a larger publishing schedule.
For honest reporting, pair follower-based engagement with at least one exposure or volume metric. X analytics provides the inputs for impression-based and per-post calculations, while follower-based reporting usually requires you to combine interaction data with your follower count yourself.
Qualitative Signals That Matter More Than the Percent
The headline percentage is a compressed summary. It tells you how much interaction occurred relative to a denominator, but it doesn’t explain whether people found the post useful, debated it, shared it with the right audience, or returned to it later.
Track these signals alongside the rate:
- Reply depth: Look beyond reply count and examine how substantial the responses are. A post that starts a thoughtful discussion is strategically different from one that collects short acknowledgments.
- Repost velocity: Watch how quickly reposts and quotes arrive after publication. Early sharing can indicate that the post is traveling beyond your immediate audience.
- Follower growth relative to engagement: Compare audience growth with the engagement trajectory over the same 30-day window. A rising rate without discovery may mean your existing audience is becoming more active.
- Bookmarks and saves: When visible in analytics, these actions can indicate reference intent. Someone saving a post may plan to use it later, even if they never reply publicly.
Consider two accounts that both report 1.2% engagement. One generates replies averaging 8 words, while the other averages 1.5 words. The first account is creating more room for follow-up conversation, audience research, and relationship building, even though the top-line percentage is identical.
Practical rule: Treat the rate as the starting signal. Treat the content of the replies and the direction of reposts as the diagnosis.
This is especially relevant for founders, analysts, and creators. A smaller number of detailed replies from relevant people can be more useful than a larger number of low-context reactions. The percentage can’t make that distinction on its own.
Factors That Move Your Expected Rate Up or Down
Follower count sets the broad expectation, but it doesn’t determine the result. Two accounts with the same audience size can perform differently because their audiences, formats, and publishing habits create different opportunities for interaction.
Audience and content fit
Niche concentration is one of the strongest structural differences. A focused account about a defined problem gives followers a clear reason to respond, while a general-interest account may attract a broader but less cohesive audience. Compare yourself with accounts whose audience has similar intent, not merely similar reach.
Format mix changes the type of response a post invites. A poll can prompt quick participation, a thread can create several reply points, and a quote post with original commentary can give followers a clear position to react to. A text-only update may work well too, but it needs a strong idea or conversational opening.
Publishing behavior
Cadence affects how often your audience encounters your ideas and how much content competes for attention. Sporadic publishing makes it harder to identify a stable baseline, while excessive posting can split attention across too many updates. Use a schedule you can sustain and evaluate the output with the same denominator.
Timing matters because X is a fast-moving feed. Start with your own analytics rather than copying a generic schedule. The best time to post on Twitter depends on when your specific audience is active and available to respond.
Community behavior also differs by niche. Some audiences naturally debate, troubleshoot, and quote one another. Others mostly consume updates. That difference can shift the expected mix of replies, reposts, and likes without indicating a content failure.
Account history complicates comparisons further. Older accounts may contain inactive or irrelevant followers, while newer accounts may have a more concentrated base. Treat an unusually low rate as a prompt to inspect audience fit, content direction, and follower quality rather than as proof that every post is weak.
Common Measurement Mistakes and Quick Fixes
Small reporting choices can change whether an account appears healthy or weak. Audit the measurement process before changing your content strategy.
-
Mixing denominators. Dividing engagements by impressions and labeling the result follower-based engagement overstates the relationship with followers. Choose one denominator for the benchmark, name it clearly, and treat the other formulas as supporting metrics.
-
Counting follower growth as engagement. A new follower measures audience growth, not the same behavior as a like, reply, repost, quote, or click. Track growth separately, then compare both trends to see whether discovery is producing interaction.
-
Using one post or an unusual week. A single post may reflect a distinctive topic, mention, event, or distribution pattern. Use a rolling period and enough posts to reduce outlier effects. For practical benchmarking, use a 30-day median of original-post interactions, consistent with the methodology noted earlier.
-
Blending original posts with replies. These formats serve different purposes. Replies can strengthen relationships and generate profile visits, while original posts provide a cleaner base for content comparisons. Report them separately whenever possible.
A useful audit should answer three questions: Which actions were counted? Which denominator was used? Did the sample cover a normal run of posts? If those answers change between reports, an apparent trend may reflect revised measurement rather than altered audience behavior.
For repeatable reporting, use a dedicated Twitter analytics dashboard or a spreadsheet with fixed column definitions. A simpler system applied consistently produces a more reliable baseline than a complex dashboard with changing rules.
Tactics to Raise Your Engagement Rate This Week
Improving the number starts with improving the behaviors that create meaningful interaction. Use a one-week test, keep the denominator unchanged, and judge the result against your recent baseline.
Begin with conversations
Reply to five thoughtful posts daily from accounts one tier above your own. Don’t leave generic praise. Add a counterexample, explain a practical detail, answer an unresolved question, or connect the topic to your own area of expertise.
Choose conversations where your reply can stand alone. The immediate target isn’t a vanity reaction. It’s a stronger reply-to-impression relationship, more profile discovery, and a clearer association between your account and a useful perspective.
Remix ideas without copying
Find posts that earned attention in your niche, then study the underlying structure. A useful workflow is:
- Identify the hook.
- Separate the claim from the supporting evidence.
- Replace the original context with your own experience, product category, or audience problem.
- Add a distinct conclusion or practical implication.
- Publish only after checking that the draft sounds like you.
A guide to improving social media engagement can help you think about conversation design more broadly, but your X version should stay native to short posts, replies, quote posts, and threads.
Test formats deliberately
Mix formats instead of assuming one format always wins. Use a short opinion post to test a thesis, a thread when the explanation needs multiple steps, a poll when the audience can choose among clear options, and a quote post when you have a substantive response to someone else’s idea.
Track which format produces deeper replies and faster reposts, not just which one receives the most likes. Keep the topic as consistent as possible during the test so you can distinguish format effects from subject-matter effects.
Build a sustainable cadence
Plan the week around the times your audience is most likely to respond. Publish your strongest post during one of your observed engagement windows, then remain available to answer early replies rather than immediately disappearing.
If manual research and planning consume too much time, Xholic AI combines personalized AI replies, Reply Deck for finding worthwhile conversations, Tweet Remixer for adapting ideas, and Smart Scheduler for approved drafts. Its Xholic Brain stores your voice, niche, audience, product context, saved posts, preferences, and feedback, while you review and control what gets published. It isn’t a fully autonomous engagement bot.
Use the same denominator for a rolling 7-day rate and compare it with the prior week. Then apply this three-check rule:
- Tier check: Is the result sensible for your follower band?
- Baseline check: Is the rolling rate moving relative to your 30-day average?
- Quality check: Is at least one signal, such as reply depth or repost velocity, improving too?
That rule is more useful than chasing a universal percentage. Benchmark your account against its follower tier, then test the reply-and-remix workflow to move the rate toward the healthy range for your audience.
Xholic AI helps you measure follower-based engagement, find worthwhile conversations, study successful posts, create context-aware replies, remix ideas, and schedule approved content without losing control of your voice. Visit Xholic AI to benchmark your account and build a more consistent reply-and-content workflow on X.