You’re looking at a tweet with a large impression count, but your follower growth and engagement don’t seem to match it. The confusion usually comes down to one question: what’s the difference between impressions and reach on X (formerly Twitter)? Impressions count total views, including repeat views from the same account. Reach counts unique accounts that saw the post. X generally reports impressions in native analytics, not organic reach, so you need to interpret impressions alongside engagement and other signals rather than treating them as a direct count of people reached.
Introduction Answering Impressions vs Reach on X Quickly
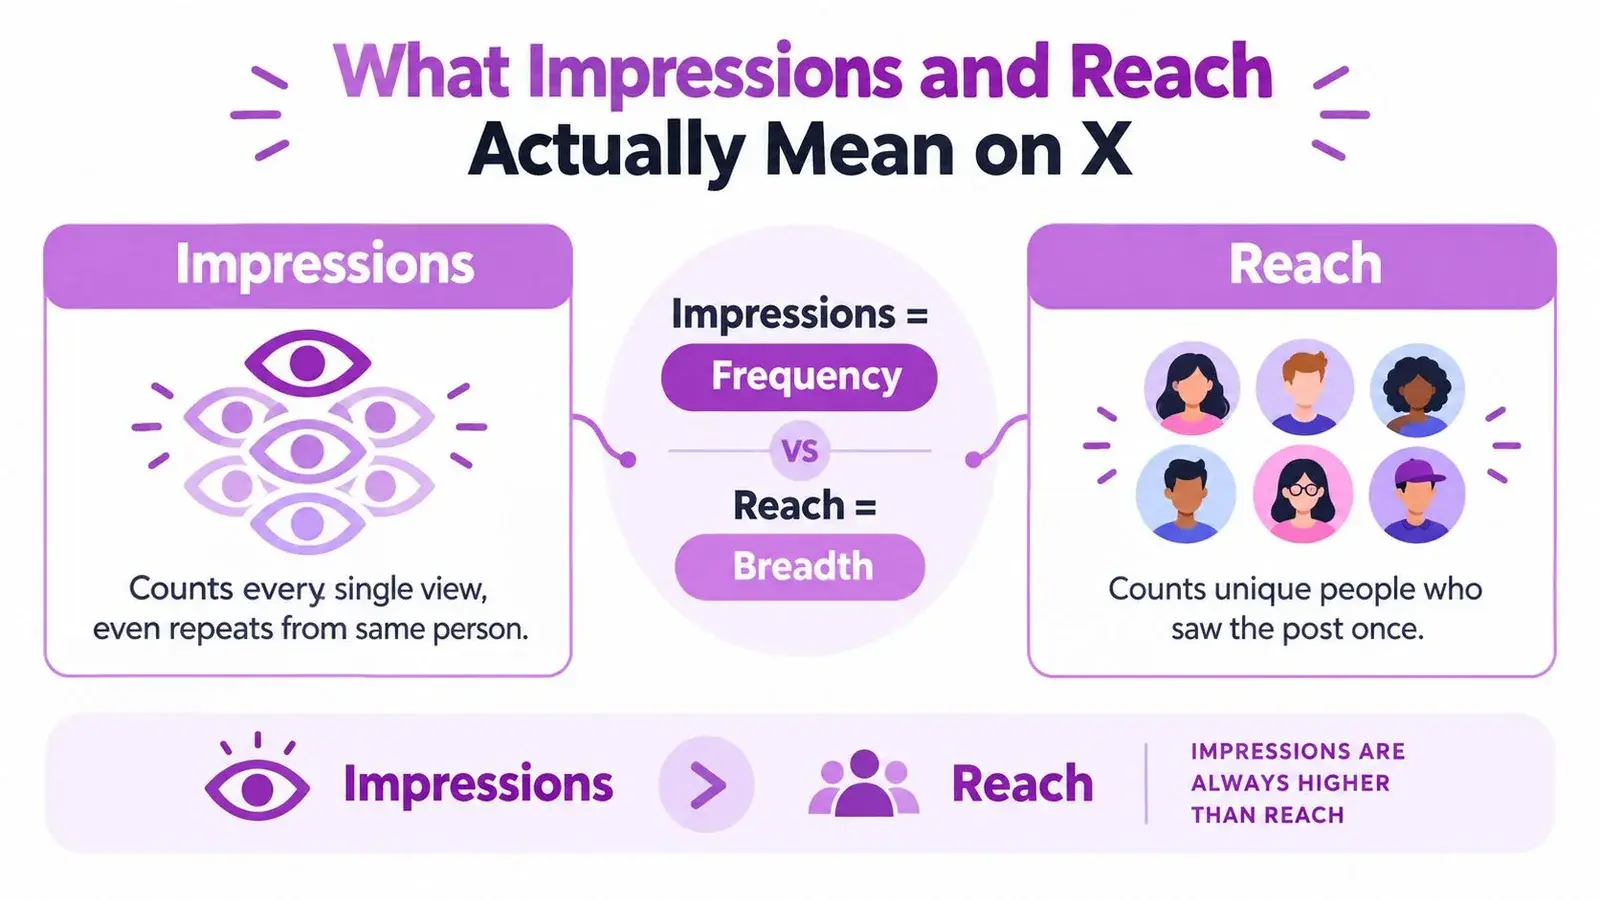
The short answer is simple. Impressions measure frequency, while reach measures breadth. If the same person sees your post several times, every appearance adds to impressions, but that person still counts only once toward reach. For creators, founders, marketers, and social media managers, that distinction determines whether a post created broad awareness or repeated exposure inside an existing audience.
A high impression count can mean your post appeared across timelines, search, replies, or repost contexts. It can also mean the same cluster of users saw it repeatedly. A post with fewer impressions may still have broader audience exposure if it was shown to more unique accounts with less repetition.
The reporting problem is that X’s native analytics generally show impressions but not organic reach. Creators therefore have to use related signals, rough calculations, or third-party tools when they want to estimate audience expansion. The result is a common reporting mistake: calling impressions “reach” and then assuming the number represents unique people.
The practical interpretation
Use impressions to answer:
- How much visibility did this post receive?
- Was it repeatedly shown to people who already had access to it?
- Did distribution increase across X surfaces?
Use reach, or reach-like signals, to answer:
- Did the post reach a wider set of accounts?
- Did it move beyond the follower graph?
- Did a reply or quote post introduce your account to new people?
You won’t always be able to produce a precise organic reach number on X. You can still make better decisions by separating your content into discovery, engagement, and conversion workflows, then judging each with the metric that matches its purpose.
This guide explains the definitions, the limits of X analytics, the difference between frequency and audience expansion, and a practical workflow for interpreting impressions when unique reach isn’t available. It also shows how to evaluate replies, quote posts, and follow-up content without mistaking more views for more people.
Practical rule: A bigger impression count doesn’t automatically mean a bigger audience.
What Impressions and Reach Actually Mean on X
Impressions are non-unique exposures. Each time a post appears on a screen, X can count another impression, even if the same account has already seen it. Reach is deduplicated exposure, meaning it counts the unique accounts that saw the post rather than the total number of appearances. This distinction is explained in Twitter analytics definitions and metrics.
A useful analogy is a room with a screen. Impressions tell you how many times the screen displayed your message. Reach tells you how many different people were in the room when they saw it. The first metric captures repetition, while the second captures audience breadth.
A simple example
Suppose one person sees the same tweet 5 times. That produces 5 impressions, but the reach is 1 account. The post has generated repeated visibility for one viewer, not exposure to five different people.
That example scales to larger audiences. A post can accumulate many impressions through repeated appearances in a follower’s timeline, a search result, a reply thread, or a repost context. The impression count records those exposures, but it doesn’t reveal how many accounts were responsible unless a separate reach measurement is available.
| Metric | What it counts | Best interpretation | Main limitation |
|---|---|---|---|
| Impressions | Total post appearances | Visibility and frequency | Doesn’t deduplicate viewers |
| Reach | Unique accounts exposed | Audience breadth and expansion | Organic reach usually isn’t shown natively |
| Engagement | Actions such as replies, likes, reposts, or clicks | Response to the post | Doesn’t measure every viewer |
| Follower growth | New accounts following you | Account-level audience movement | Doesn’t identify every person who saw a post |
Impressions are often useful at the top of the funnel because they show how widely a message was distributed in total. Reach is more useful when you’re evaluating whether a post expanded the audience or concentrated exposure among people who already follow or recognize you.
The two metrics can move in different directions. More impressions may reflect stronger frequency without meaningful audience expansion. More reach may reflect broader distribution even when each viewer sees the post only once.
For a deeper explanation of how view counts relate to engagement, see this guide to what impressions mean on Twitter.
How X Calculates and Reports Each Metric Today
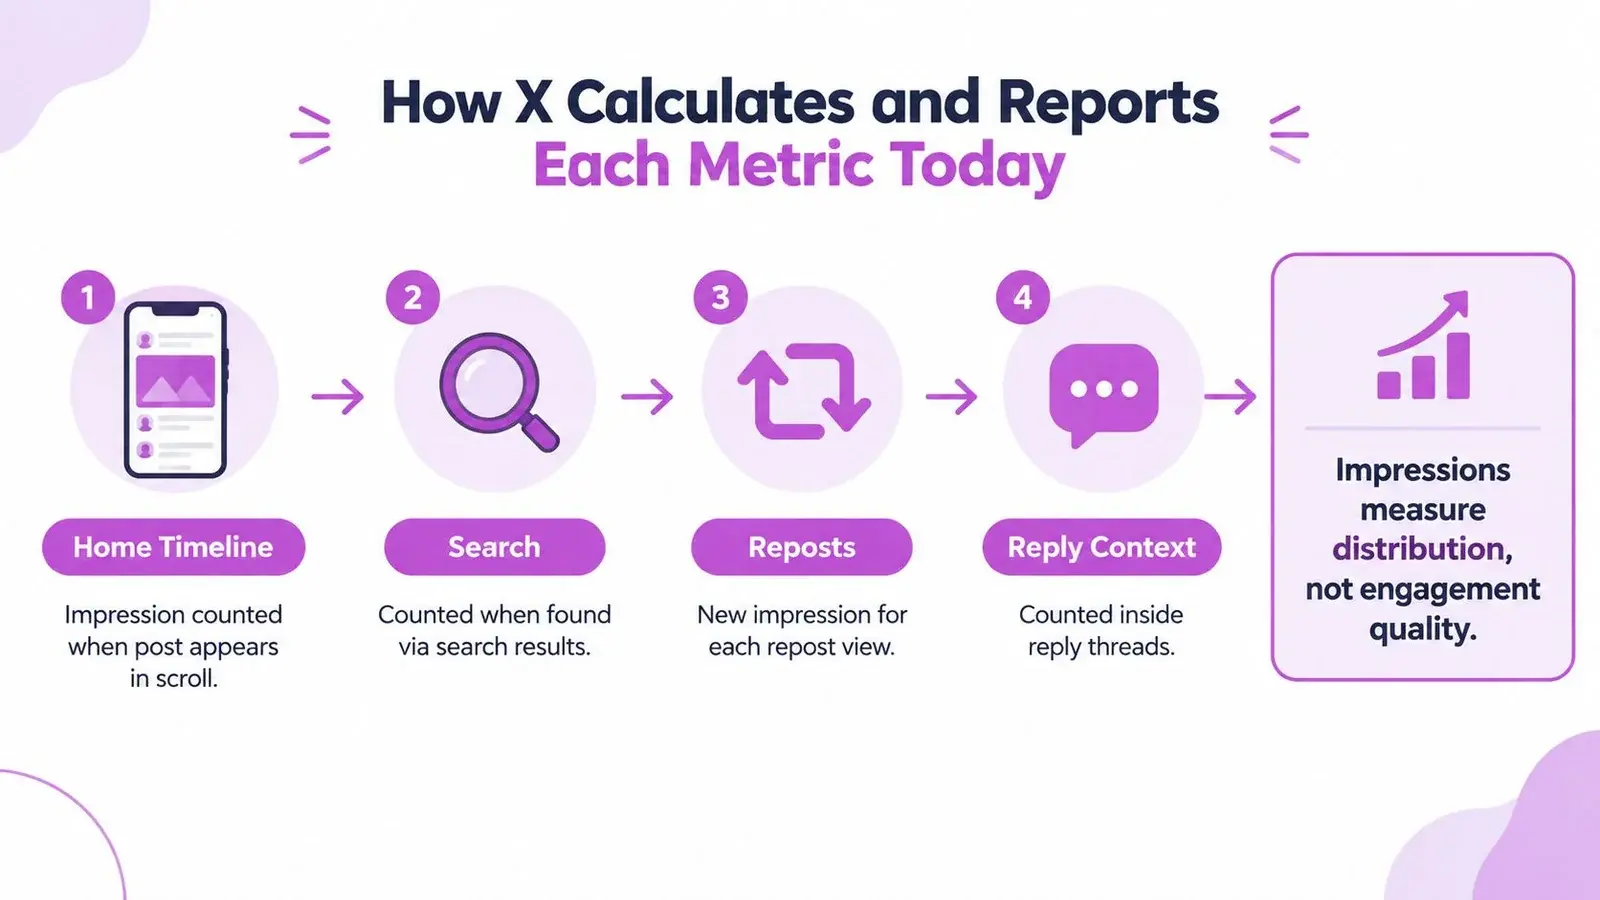
X can count an impression when a post appears across several surfaces, including the home timeline, search results, repost contexts, and reply threads. That makes impressions useful for understanding distribution. It doesn’t make them a reliable measure of attention, intent, or audience fit.
A post can appear in a home timeline without receiving a like. It can surface in search without producing a profile visit. It can be visible inside a reply conversation while attracting no click or follow. An impression tells you that the post appeared, not that the viewer engaged with it or belonged to your target audience.
Why native analytics create confusion
X’s native analytics generally report impressions but not standard organic reach. As a result, creators often need proxies or third-party measurement to estimate how many unique accounts saw a post. The limitation matters because public counters and first-party analytics aren’t interchangeable, and a visible number can look more precise than it really is.
One commonly used rough benchmark is:
Estimated reach percentage = (impressions ÷ followers) × 100
This calculation should be treated only as a directional benchmark, as explained in X analytics metrics and measurement limits. Follower count isn’t the same as unique viewers, and repeated exposure increases impressions without necessarily adding new accounts. Two posts with the same impression count can therefore have very different reach profiles.
For example, one post might earn most of its views from a compact group that sees it repeatedly. Another might be shown once to a much wider set of accounts. The impression totals could look similar, but the audience behavior is different.
Use the metric for the question it can answer
Impressions can help you evaluate:
- Distribution: Did the post appear in more places?
- Frequency: Did the same audience receive repeated exposure?
- Visibility: Did a post maintain attention across its active lifecycle?
They can’t independently confirm:
- Unique audience size
- Engagement quality
- Audience relevance
- Clicks or conversions
This is why impressions belong in a wider measurement workflow. Pair them with replies, likes, reposts, profile visits, clicks, follower movement, and the post’s role in your content system.
For a more practical dashboard workflow, use this guide to master your Twitter analytics dashboard. The goal isn’t to force an exact reach number from incomplete data. It’s to make your interpretation more honest and useful.
Impressions vs Reach Side by Side Comparison for Decision Making
The most useful way to compare impressions and reach is by decision. Don’t ask which metric is universally better. Ask whether you’re measuring repeated visibility or audience expansion.
| Goal or Scenario | Prioritize This Metric | Why It Matters | Watch Out For |
|---|---|---|---|
| Brand awareness | Impressions | Shows how often the message appeared across X | Repeated views can inflate visibility without expanding the audience |
| New audience discovery | Reach or reach-like signals | Indicates whether more unique accounts encountered the post | Organic reach may need to be inferred |
| Reply strategy | Reach-like signals plus profile visits | Helps assess whether a reply introduced you to new accounts | High impressions can come from one active conversation |
| Product education | Impressions plus engagement | Repeated exposure may help people recognize the idea or offer | Views alone don’t prove understanding |
| Product demand | Clicks, replies, profile visits, and follows | Connects distribution to meaningful actions | Impression volume doesn’t establish intent |
| Content frequency | Impressions | Reveals how often posts are being surfaced | High frequency can become overexposure |
| Campaign reporting | Both, clearly labeled | Separates total exposure from unique audience breadth | Never label an estimate as native organic reach |
Recent coverage continues to describe X’s native analytics as impression-centered, with reach commonly inferred through advertising tools or third-party measurement. That creates a practical blind spot for creators who optimize around the most visible counter. The comparison of reach and impressions on Twitter also supports treating the metrics as complementary rather than interchangeable.
The key distinction: Impressions measure how often distribution happened. Reach measures how broadly the audience was distributed.
When the metrics point in opposite directions
A post with high impressions and weak reach-like signals may be getting repeated exposure from followers, active replies, or search viewers who return to the same discussion. That can still be useful for familiarity, but it shouldn’t be reported as audience growth.
A post with moderate impressions and strong reach-like signals may have introduced your account to many unique viewers. If those viewers also visit your profile, follow, reply, or click, the post may be more valuable for growth than a higher-impression post that produced no downstream action.
For a practical reporting system, label each post by its job:
- Discovery posts aim to reach accounts outside your usual audience.
- Engagement posts aim to create conversation with a relevant community.
- Conversion posts aim to move interested people toward a profile visit, click, signup, or direct conversation.
The same impression number means something different in each bucket. A discovery post needs evidence of breadth. An engagement reply needs evidence of relevant interaction. A conversion post needs evidence that viewers took the next step.
Real World Examples That Show the Difference in Action
Three X posts can produce similar impression totals while doing very different work for an account. Without organic reach data, you have to read the surrounding signals and consider how the post was distributed.

A discovery post that keeps resurfacing
A founder publishes a concise lesson about building a product. The post is reposted, appears in search, and continues to surface in conversations. Its impressions rise as people encounter it repeatedly.
That visibility is useful, but the founder shouldn’t assume every new impression represents a new account. If profile visits and follows remain quiet, the post may be accumulating frequency among an existing cluster rather than expanding the audience.
The right question is: Did the post create new account-level actions, or did it remain visible?
A niche reply with concentrated exposure
A creator writes a thoughtful reply under a large account’s post. The reply becomes part of an active thread, so people return to the conversation and see it more than once. Impressions increase, but most viewers may be connected to that one topic or community.
This can still be an excellent engagement result. The reply may establish authority with a concentrated group of relevant readers. It becomes a reach problem only when the creator reports the impression count as proof of broad audience growth.
Track the reply’s profile visits, follows, quality of responses, and whether people continue interacting with later posts. Those signals help distinguish a useful community touchpoint from empty repetition.
A product post with wider but lighter exposure
A startup shares a product explanation that receives less visible activity than its strongest posts. Yet the post attracts viewers from several relevant conversations, and some visit the profile or follow the account.
The lower impression total doesn’t automatically make it weaker. If its audience was broader and more relevant, it may have done more to create demand than a post that was repeatedly shown to existing followers.
This is the operational issue many basic explanations miss. Since X reports impressions rather than deduplicated organic reach, creators need to ask whether a reply, quote post, or follow-up is widening exposure or only adding views from the same cluster. The difference is between audience growth and frequency, not between a good metric and a bad one.
How to Measure and Interpret Impressions vs Reach Without Native Reach Data
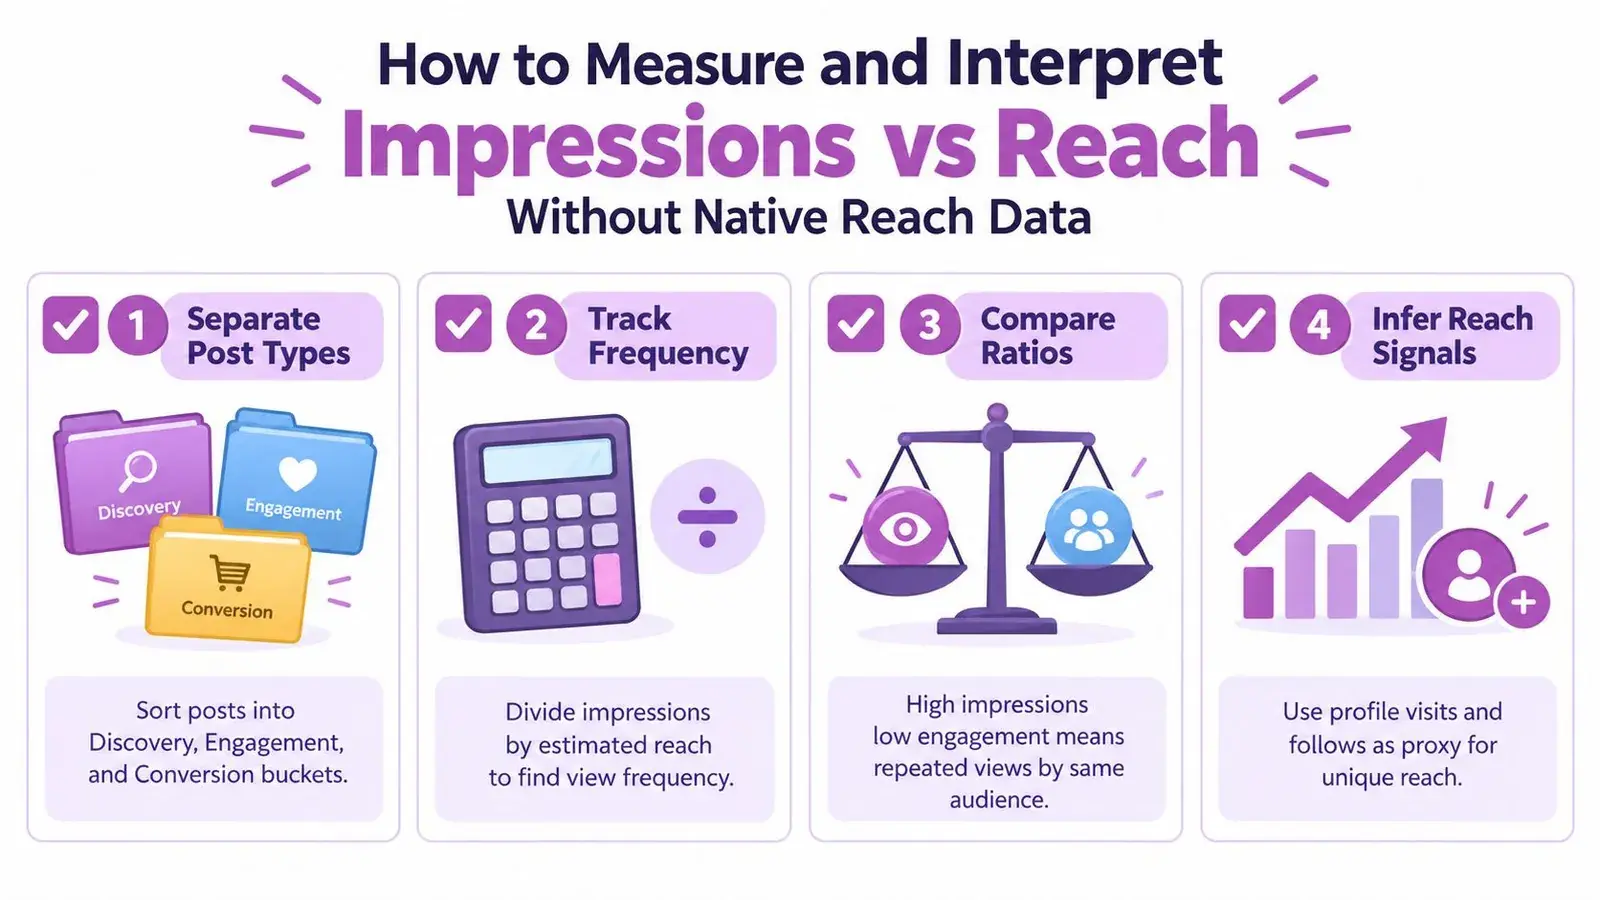
X doesn’t natively report organic reach as a standard analytics metric. Creators and marketers usually combine impressions, engagement, and third-party estimates to infer how many unique accounts may have seen a post, as described in Twitter impressions measurement options.
Step 1 Sort posts by purpose
Create three reporting buckets:
- Discovery: Posts designed to attract unfamiliar accounts through ideas, analysis, or participation in wider conversations.
- Engagement: Replies, quote posts, and community contributions designed to create relevant interaction.
- Conversion: Posts connected to a product, newsletter, profile, signup, or direct business action.
This prevents you from comparing a reply and a launch post as if they had identical jobs.
Step 2 Read impressions as frequency
Record impressions for each post, then compare that number with engagement and profile activity. If impressions rise while meaningful actions stay flat, treat the result as visibility or repetition, not proof of audience expansion.
You can apply the rough impressions-to-followers benchmark mentioned earlier, but don’t present it as measured organic reach. It can help you compare posts on the same account over time, provided you keep the caveats visible.
Step 3 Look for reach-like signals
Use profile visits, follows, replies from unfamiliar accounts, clicks, and saves as directional evidence. None of these replaces deduplicated reach, but together they can show whether distribution produced movement beyond passive exposure.
For a broader measurement framework, this guide on key performance indicators can help you connect visibility metrics with actions that matter to the business.
Step 4 Compare similar posts
Compare discovery posts with other discovery posts, replies with other replies, and conversion posts with other conversion posts. Look for patterns such as:
- High impressions, low action: Possible repetition or weak audience fit.
- Moderate impressions, strong profile activity: Possible relevance to a focused audience.
- Strong replies from new accounts: Evidence that the conversation may be widening exposure.
- Repeated impressions after a follow-up: Useful frequency, but not necessarily new reach.
Tools can reduce the manual work. Xholic AI can help users study content patterns with its Inspiration Library and Tweet X-Ray, then focus engagement research through Reply Deck. Its role is to support decisions and personalized workflows, not to replace measurement or publish unreviewed content. You can also compare available options in this guide to free Twitter analytics tools.
Keep a simple spreadsheet or dashboard with the post type, impressions, engagement, profile visits, follows, clicks, and notes about where the post appeared. The notes matter because a post that spreads through replies may need a different interpretation from one that performs through search or reposts.
Which Metric to Optimize and Next Steps to Improve Performance on X
Choose the metric that matches the job of the post.
For awareness, impressions can show whether your message is being distributed and seen repeatedly. For audience growth, prioritize reach-like evidence, such as profile visits, follows, replies from unfamiliar accounts, and exposure across conversations outside your usual follower group. For product demand, impressions are only an opening signal. Clicks, replies, profile visits, and other meaningful actions deserve more weight.
Because impressions include appearances in timelines, search results, repost contexts, and reply contexts, they measure distribution but not whether viewers engaged, clicked, or matched your target audience, as explained in this X analytics metrics guide.
A practical optimization checklist
- Label the post: Mark it as discovery, engagement, or conversion.
- Record the exposure: Save impressions and the surfaces or conversations that likely contributed.
- Check the response: Compare impressions with replies, likes, reposts, profile visits, clicks, and follows.
- Assess concentration: Ask whether one thread, follower group, or recurring audience likely drove the views.
- Review the next action: Decide whether to publish a follow-up, join a related conversation, or change the message.
- Report: Keep native impressions, estimated reach, and reach-like proxies in separate fields.
If you’re building a broader dashboard, this overview of key metrics for growth provides useful context for connecting platform activity with business outcomes. You can also use the Twitter analytics metrics guide to organize the terms and calculations that matter to your account.
Don’t optimize for the biggest visible impression count by default. A post that reaches fewer people but attracts the right profile visits or product conversations may be doing more useful work than a post with broad repetition and no next step.
The next review should answer three questions: Was the post seen, was it seen by new accounts, and did those accounts do anything meaningful? Impressions answer only the first question reliably.
Xholic AI helps you study which posts and conversations fit your niche, using personalized context through Xholic Brain rather than generic tweet generation. Use it to organize relevant replies, analyze proven structures, and plan approved content with Smart Scheduler, then review every suggestion before publishing. Visit Xholic AI to turn your impressions and reach-like signals into a clearer, more consistent X growth workflow.