“Should we be on X?” is usually settled by whoever feels strongest in the meeting. Someone saw a competitor do well there, someone else thinks the platform is noise, and the company ends up either posting half-heartedly for a year or not trying at all.
A better way to decide is to check the conditions that make X work for a business, and to be strict about evidence. Are your buyers actually there? Is anyone on the team able to reply? Can you tell whether a visit from X turned into anything?
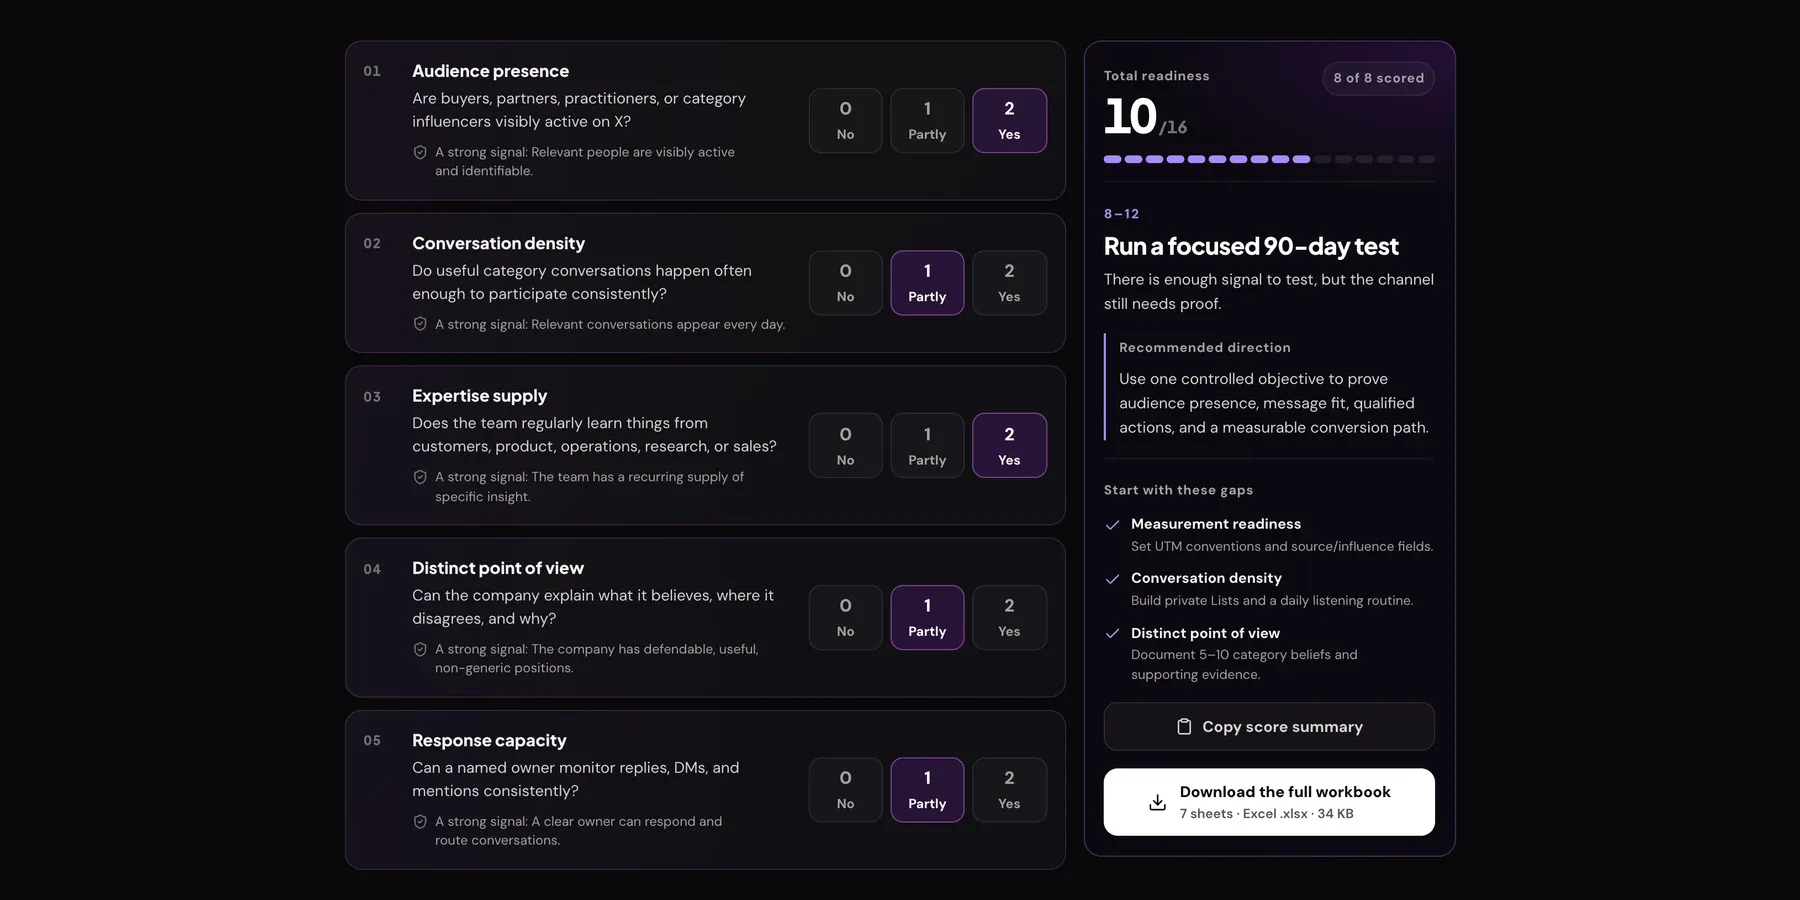
Xholic’s free X Business Readiness Scorecard turns those questions into eight signals scored from 0 to 2. This guide explains each signal and score band, works through an example, and shows how to carry the result into the workbook’s 90-day plan. For the full strategy of running X as a business channel, see our X for business guide.
The 0–2 evidence scale
Every signal uses the same three-point scale. The tool’s legend spells it out:
| Score | Label in the tool | Use it when |
|---|---|---|
| 0 | Not true today | You have no evidence, or the evidence says no. |
| 1 | Partly true or unproven | It’s sometimes true, true for one person, or you believe it but haven’t checked. |
| 2 | Clearly true | You could show someone the proof today. |
Score what is true today, not what the team hopes will become true. “We’ll hire a community manager next quarter” is a 0 for response capacity until that person exists. The eight scores add up to a total out of 16, with no weighting.
How to score your business, step by step
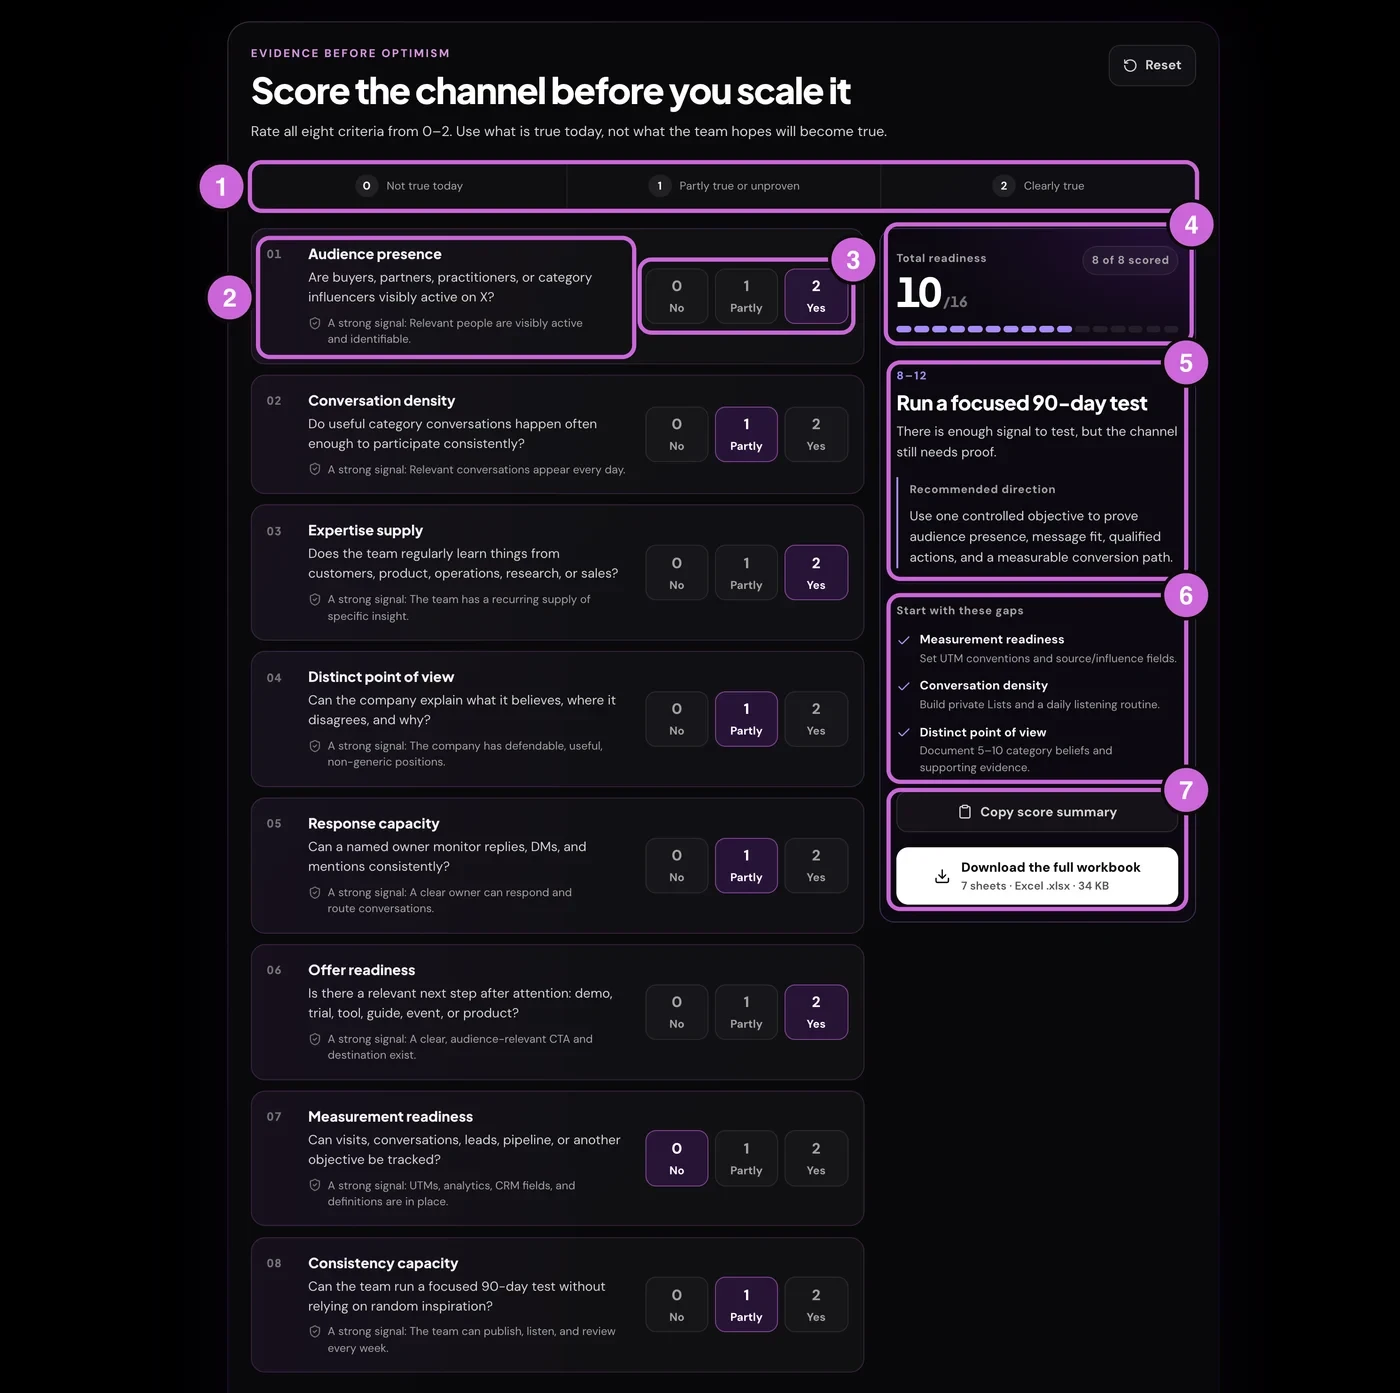
Step 1: Agree the scale before anyone scores
Read the legend (1) with whoever is scoring. Ideally score with people from marketing, sales and support: each sees different evidence, and a disagreement usually means the signal deserves a 1.
Step 2: Read the question and the strong-signal hint
Each signal (2) has a question and an “A strong signal:” line describing what a 2 looks like. Compare your evidence to that line.
Step 3: Pick 0, 1 or 2
Click No, Partly or Yes (3). You can change a score at any time, and Reset in the top corner clears all eight.
Step 4: Watch the total
The right-hand panel (4) shows the running total, a 16-segment meter and how many signals you’ve scored. There’s no verdict until all eight are scored.
Step 5: Read the band and the recommended direction
The tool then shows the score range, band name, description and a recommended direction (5), explained in the band section below.
Step 6: Start with the listed gaps
Under “Start with these gaps” (6), the tool lists up to three signals to fix first, each with a specific action. It picks them by taking every signal scored below 2, sorting by score so the 0s come first, and keeping the first three. When scores tie, they appear in the order the signals are listed, so a tie between Conversation density and Measurement readiness lists Conversation density first. Score all eight at 2 and the list disappears.
Step 7: Copy the summary or download the workbook
Copy score summary (7) copies plain text with your score out of 16, the band and range, its description, the recommended actions and a link to the workbook, ready to paste into a planning doc. Download the full workbook saves the seven-sheet Excel file described below.
The eight readiness signals explained
1. Audience presence
Are buyers, partners, practitioners or category influencers visibly active on X? A 2 means relevant people are visibly active and identifiable. Test it by searching your buyers’ job titles, competitors and category terms. The recommended action is to map 25–50 priority accounts and conversations.
2. Conversation density
Do useful category conversations happen often enough to take part consistently? A 2 means relevant conversations appear every day. Action: build private Lists and a daily listening routine.
3. Expertise supply
Does the team regularly learn things from customers, product, operations, research or sales? A 2 means a recurring supply of specific insight, not general opinions. Action: create a weekly evidence-capture meeting or form, so what sales and support hear reaches whoever writes the posts.
4. Distinct point of view
Can the company explain what it believes, where it disagrees, and why? A 2 means defendable, useful, non-generic positions. Action: document 5–10 category beliefs with supporting evidence.
5. Response capacity
Can a named owner monitor replies, DMs and mentions consistently? A 2 means a clear owner can respond and route conversations. “The social team” with no named person is a 1. Action: assign an owner, response windows and handoffs. If customers already ask for help on X, our Twitter customer support guide covers the support side.
6. Offer readiness
Is there a relevant next step after someone pays attention: a demo, trial, tool, guide, event or product? A 2 means a clear, audience-relevant call to action and destination exist. Action: improve the landing page and the path from your pinned post.
7. Measurement readiness
Can visits, conversations, leads, pipeline or another objective be tracked? A 2 means UTMs, analytics, CRM fields and definitions are in place. It’s the signal teams skip most, and why many X programmes get cut: nobody can show what they produced. Action: set UTM conventions and source or influence fields in your CRM.
8. Consistency capacity
Can the team run a focused 90-day test without relying on random inspiration? A 2 means the team can publish, listen and review every week. Action: create a 13-week operating plan with a realistic cadence. The workbook ships with one.
What each score band recommends
| Total | Band | What the tool says | What to do next |
|---|---|---|---|
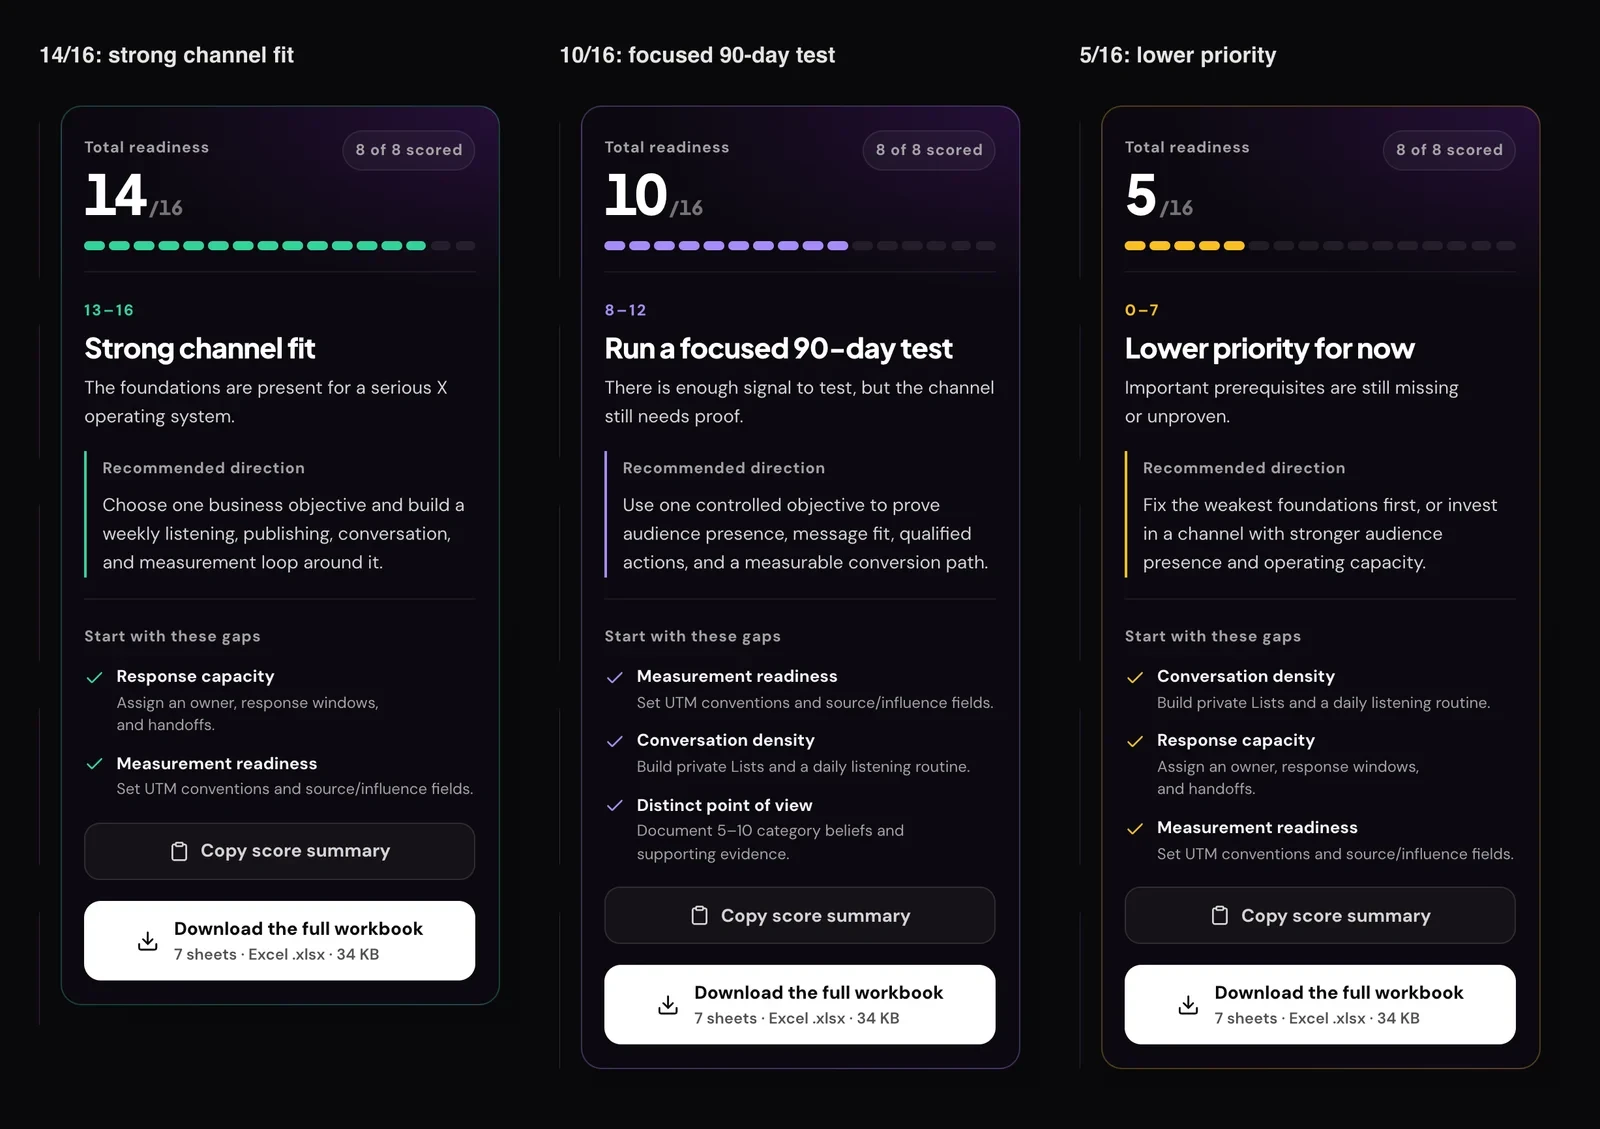
| 13–16 | Strong channel fit | The foundations are present for a serious X operating system. | Choose one business objective and build a weekly listening, publishing, conversation and measurement loop around it. |
| 8–12 | Run a focused 90-day test | There is enough signal to test, but the channel still needs proof. | Use one controlled objective to prove audience presence, message fit, qualified actions and a measurable conversion path. |
| 0–7 | Lower priority for now | Important prerequisites are still missing or unproven. | Fix the weakest foundations first, or invest in a channel with stronger audience presence and operating capacity. |
- Strong fit still lists gaps. A 14 with two signals at 1 shows both. Fix them early.
- The middle band isn’t a no. It means “prove it with a time limit”.
- A low score isn’t permanent. Response and measurement gaps can close in weeks. Audience presence and conversation density are harder to change; if both are 0, X may not be where your market talks.
Worked example: a fictional B2B software company
This example is fictional. Ledgerline is an invented 40-person company selling accounts-payable software to finance teams at mid-sized firms. Its marketing lead scores the eight signals with the head of sales and a support lead:
| Signal | Score | Evidence they used |
|---|---|---|
| Audience presence | 2 | A search turned up dozens of finance leaders and AP practitioners posting about close processes. |
| Conversation density | 1 | Useful threads appear a few times a week, not daily. |
| Expertise supply | 2 | Sales and implementation calls produce new questions every week. |
| Distinct point of view | 1 | They have opinions on invoice approval, but nothing written down. |
| Response capacity | 1 | The marketing lead checks mentions when she remembers. |
| Offer readiness | 2 | A free invoice-cost calculator and a demo page already exist. |
| Measurement readiness | 0 | No UTMs; the CRM has no field for X as a source. |
| Consistency capacity | 1 | They can post weekly for a month, but nothing is planned beyond that. |
The total is 10 out of 16: Run a focused 90-day test. The tool lists three gaps: Measurement readiness first (the only 0), then Conversation density and Distinct point of view, the first two of the four signals tied at 1.
Ledgerline has buyers on X and something to offer them, but if it started posting today it couldn’t show results after 90 days. So the first two weeks go on UTM naming, a CRM source field, a private List of priority accounts and a page of five category beliefs. Then the test starts.
How to use the workbook for your 90-day plan
The download is a single Excel file, x-business-readiness-kpi-workbook.xlsx (about 34 KB), with seven sheets. Yellow cells are inputs; calculated columns fill themselves.
| Sheet | What it holds |
|---|---|
| Readiness Scorecard | The same eight signals with a 0–2 dropdown per row, an “Evidence / notes” column, the total, and a formula that labels it with the same three bands. |
| KPI Dashboard | Twelve months (August 2026 to July 2027) of funnel inputs and nine calculated rates, plus a “Qualified Actions Over Time” line chart. |
| Content Portfolio | A post log of 100 rows with dropdowns for account, content job, evidence level, format and CTA, and per-post rates. |
| UTM Builder | Fifty rows that join a landing URL with source, medium, campaign, content and term into a tagged link. |
| 90-Day Plan | A pre-filled 13-week sequence with objective, action, required output, owner, status and due date. |
| DM Pipeline | A permission-based log of conversations, from public context to outcome and revenue. |
| Definitions & Sources | The formula behind each rate and links to X’s help pages, last fact-checked July 30, 2026. |
Work through it in this order.
1. Re-score with evidence. Enter your scores in the Readiness Scorecard sheet and fill the “Evidence / notes” column, which the browser tool doesn’t keep. That’s your baseline for day 90.
2. Assign the 13 weeks. Weeks 1–4 (Foundation) set the objective, choose founder-led, company-led or hybrid accounts, secure the profile and build listening and measurement. Weeks 5–9 (System) build an evidence backlog, content portfolio, reply and DM workflows and governance. Weeks 10–13 (Prove & scale) improve qualified actions, test a conversion asset and paid distribution if ready, and end with a quarterly review. Add owners and due dates, and pull your gap actions into the earliest weeks.
3. Tag every link. Use the UTM Builder before you post. Source is a dropdown set to x, and medium offers organic_social, paid_social, profile, dm and partner. The sheet notes that it doesn’t URL-encode values, so use lowercase with hyphens or underscores rather than spaces.
4. Log posts by the job they do. In the Content Portfolio, label each post with a content job (Attract, Educate, Differentiate, Prove, Converse, Convert or Retain) and an evidence level from 1 (Opinion) to 6 (Original data). You’ll soon see which posts produce qualified actions, not just impressions.
5. Track conversations with permission. The DM Pipeline records the public context, the signal, whether permission was asked, a stage and an outcome. As the sheet puts it, a technical platform limit is never a daily outreach target.
6. Review monthly in the KPI Dashboard.
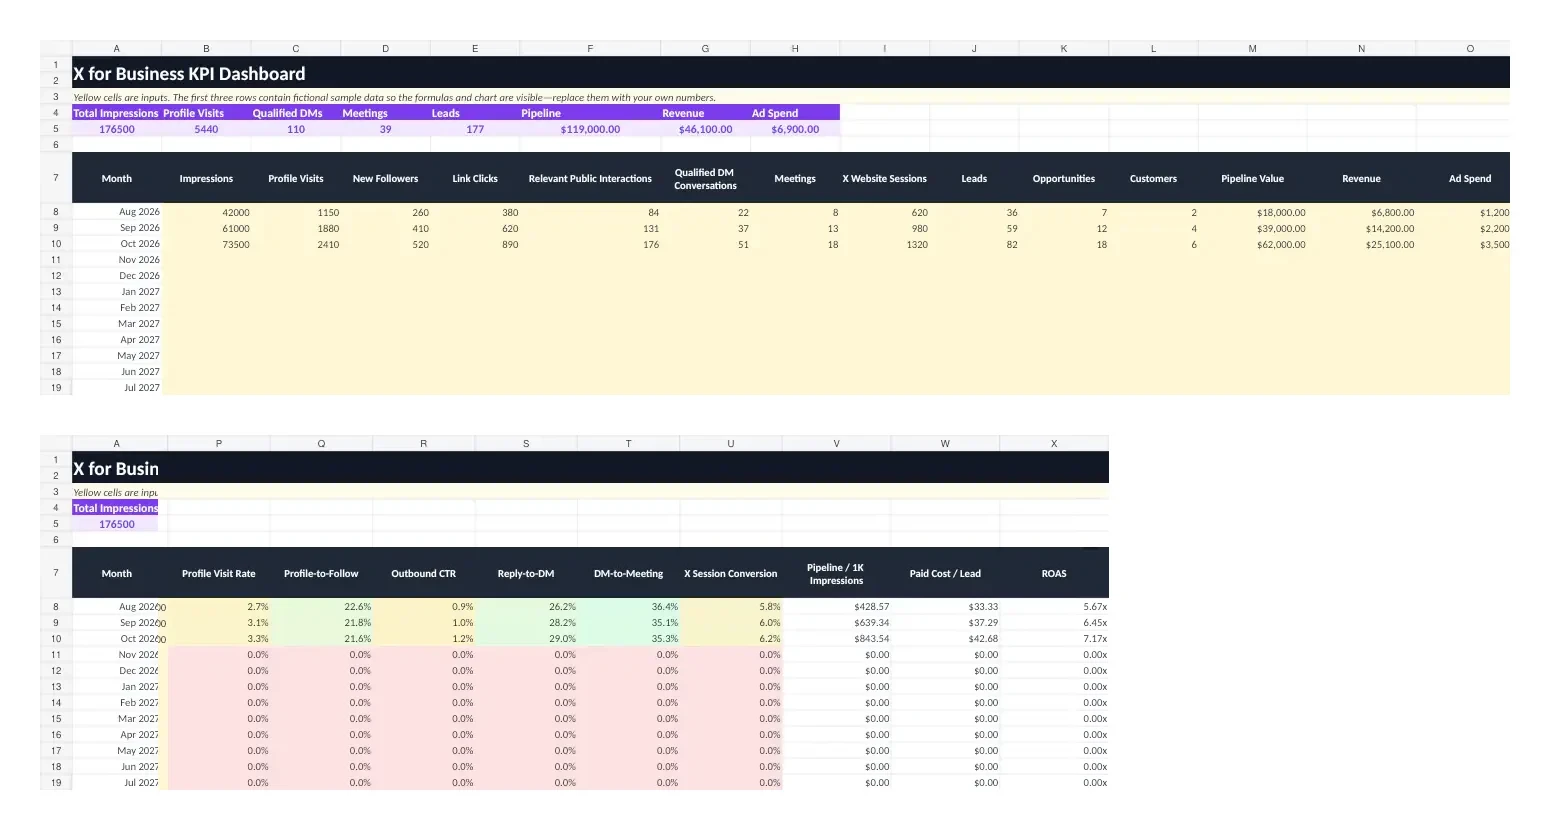
Enter one row per month, from impressions and profile visits through qualified DMs, meetings, leads and pipeline to revenue and ad spend. The sheet calculates the rates and charts qualified DMs, meetings and leads by month. The first three months (August to October 2026) are fictional sample numbers: overwrite them. “Paid Cost / Lead” divides ad spend by all leads, organic included, so treat it as blended.
At week 13, re-score all eight signals. A higher band plus rising qualified actions is the case for a bigger investment. If neither moved, you have the evidence to stop.
Troubleshooting
- No verdict or copy button. Both appear only once all eight signals are scored. Check the “of 8 scored” count.
- The copy button says “Copy failed - try again”. Your browser blocked clipboard access. Allow it for the page, or copy the result by hand.
- No “Start with these gaps” list. Every signal is at 2, so there’s nothing to list.
- The workbook total says “Lower priority for now”. Its scores start at 0. Pick a value in each Score cell.
- UTM links break. A space or special character in a field. Replace spaces with hyphens or underscores.
Frequently asked questions
Is X worth it for a B2B business?
Often, when buyers and practitioners in your category are visibly active there and your team can contribute real expertise. It’s a weaker bet when your buyers aren’t on X or nobody can reply consistently. Scoring the eight signals tells you which situation you’re in before you commit time.
What score do I need before investing in X?
13–16 suggests strong channel fit. 8–12 is enough to justify a focused 90-day test with one objective. Below 8, fix the missing foundations first or put the effort into a channel where your audience is more present.
Is a high score a guarantee that X will work?
No. It’s a channel-fit check, not a forecast of reach, leads or revenue. Use it to design a test, then compare it with your results after 90 days.
What’s in the X business account checklist workbook?
Seven sheets: Readiness Scorecard, KPI Dashboard, Content Portfolio, UTM Builder, 90-Day Plan, DM Pipeline, and Definitions & Sources. It’s a free .xlsx file of about 34 KB with no signup.
Are my answers saved?
No. The scorecard runs in your browser and doesn’t store your individual answers. Usage analytics record that a result was generated, with the total and band, not which score you gave each signal.
Related guides and tools
- X for business guide: account setup, content, ads and DMs for running X as a business channel.
- X analytics for business: which metrics connect X activity to business results.
- X Profile Audit: check whether your profile is ready for the visitors a 90-day test sends it.
- X Profile Analytics: public posting cadence and engagement for your account or a competitor’s.
- X analytics glossary: definitions for impressions, profile visits, engagement rate and more.