“How much can I make on X?” usually gets one of two answers: a payout-per-million-views figure that nobody can verify, or “it depends”. Both are useless when you’re deciding what to build.
The more useful question is which revenue path you can sell through, and what each step of it converts at. A consultant with 3,000 followers can out-earn an account with 300,000 followers, because the money comes from the conversion chain, not the audience size.
This guide uses Xholic’s free X Monetization Calculator to model that chain for the six common paths, with the exact formulas, worked numbers, and a method for finding the one assumption worth testing next.
Why there’s no reliable “X payout calculator”
Most “Twitter money calculators” multiply your views by a fixed rate. X has never published one. Its native ad payouts have always been calculated from engagement and impressions that X measures and doesn’t share in full, so a universal per-view number is a guess presented as fact.
The program also just changed. X retired Creator Revenue Sharing on September 7, 2026 and replaced it with Original Content Rewards. It pays approved creators for qualified impressions on original posts: unique Home Timeline impressions from Premium users, with replies, repeat views and paid views excluded. X’s published minimums include an active Premium plan, 500 verified followers and 500,000 verified-user Home Timeline impressions in 90 days. Check your status in Creator Studio, because X adjusts these rules without much notice. Our Twitter creator earnings breakdown covers the transition in detail.
That’s why the calculator leaves native ad payouts out on purpose and models the paths you control instead. Treat any native payout as a bonus on top of a business model, not as the business model.
For the bigger picture of how X pays creators, see our Twitter monetization guide.
The six revenue paths at a glance
Each tab in the calculator is a different business with its own formula. Here are the sample assumptions the tool starts with, so you can see how differently they behave:
| Path | Who pays you | Formula | Sample month (margin) |
|---|---|---|---|
| Services | Clients | conversations × booking rate × close rate × customer value | $1,500 (75%) |
| Sponsorships | Brands | campaigns × fee − production and admin | $1,000 (80%) |
| Affiliate | Merchants | clicks × conversion × order value × commission | $800 (92%) |
| Digital product | Customers | visitors × conversion × price | $1,470 (87%) |
| Membership | Members | members × monthly price | $2,000 (88%) |
| X Subscriptions | Your X subscribers | subscribers × monthly price | $500 (85%) |
These are illustrations, not benchmarks. The point of the table is the formula column: each path has different inputs, a different bottleneck, and different numbers you can actually measure.
How to use the calculator, step by step
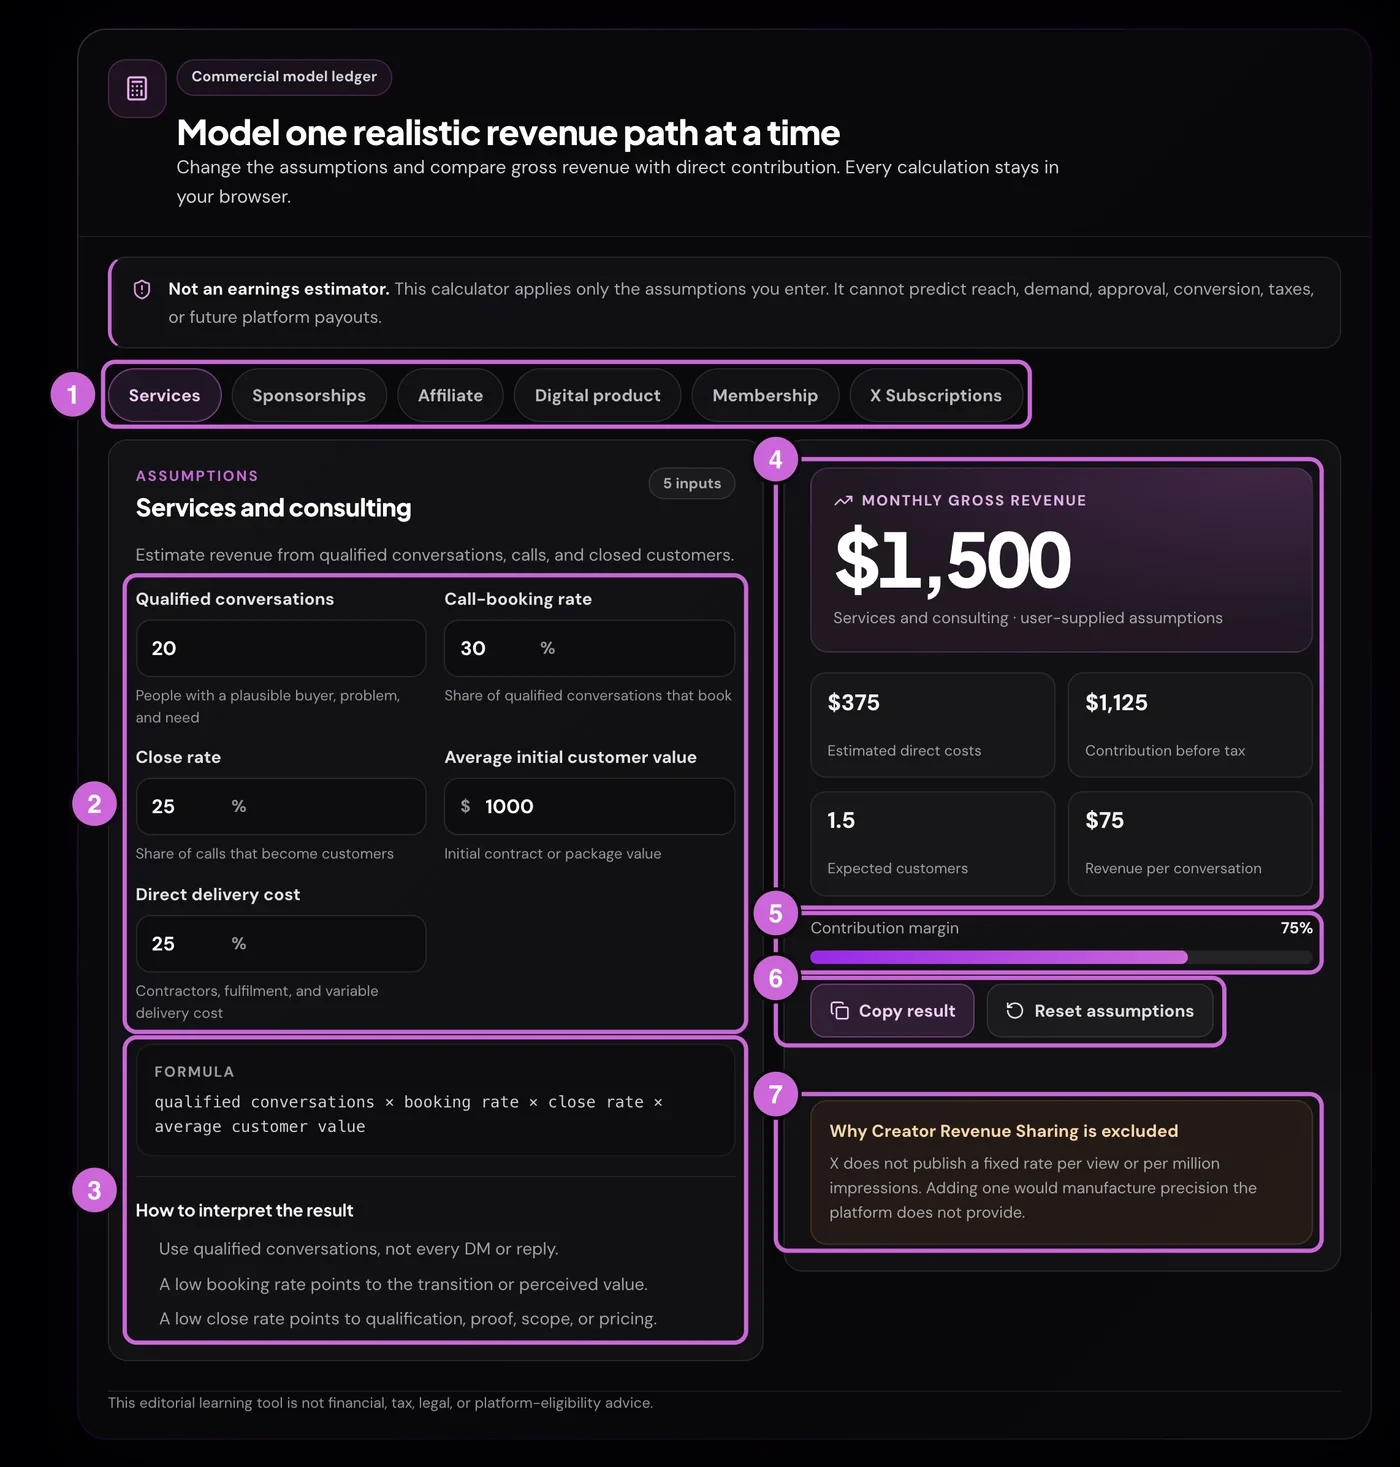
Step 1: Pick the path that matches who pays you
The tabs (1) are Services, Sponsorships, Affiliate, Digital product, Membership and X Subscriptions. Start with the path you could sell this month, not the one that looks best on paper. Each tab keeps its own numbers, so you can switch back and forth without losing work.
Step 2: Replace every sample number with one you can defend
The assumption fields (2) each have a hint underneath. Use your own data where you have it: calls booked last month, affiliate dashboard conversion, product page traffic. Where you don’t, use a deliberately cautious guess and write down that it’s a guess. Percentages are capped at 100%, negative values are rejected, and the result updates as you type.
Step 3: Read the formula and the notes
Under the inputs (3), the tool shows the exact formula and three notes on what a weak result usually means. For Services, a low booking rate points to how you move people from a post to a call, and a low close rate points to qualification, proof, scope or pricing.
Step 4: Read the ledger, not just the headline
The results panel (4) shows more than gross revenue:
- Estimated direct costs: delivery, production, fees, refunds or clawbacks, depending on the path.
- Contribution before tax: gross minus those direct costs. It is not profit, because your time, software and tax aren’t included.
- A volume figure: customers, campaigns, sales, purchases or ending members.
- A per-unit figure: revenue per conversation, per campaign, per click, per visitor or per member.
The margin bar (5) shows contribution as a share of gross. Copy result (6) puts a one-line summary on your clipboard for your planning notes, and Reset assumptions restores the samples for the current tab only.
Find the assumption worth testing next
The calculator is most useful for comparing “what if” scenarios. Change one input at a time and watch which one moves the result most.
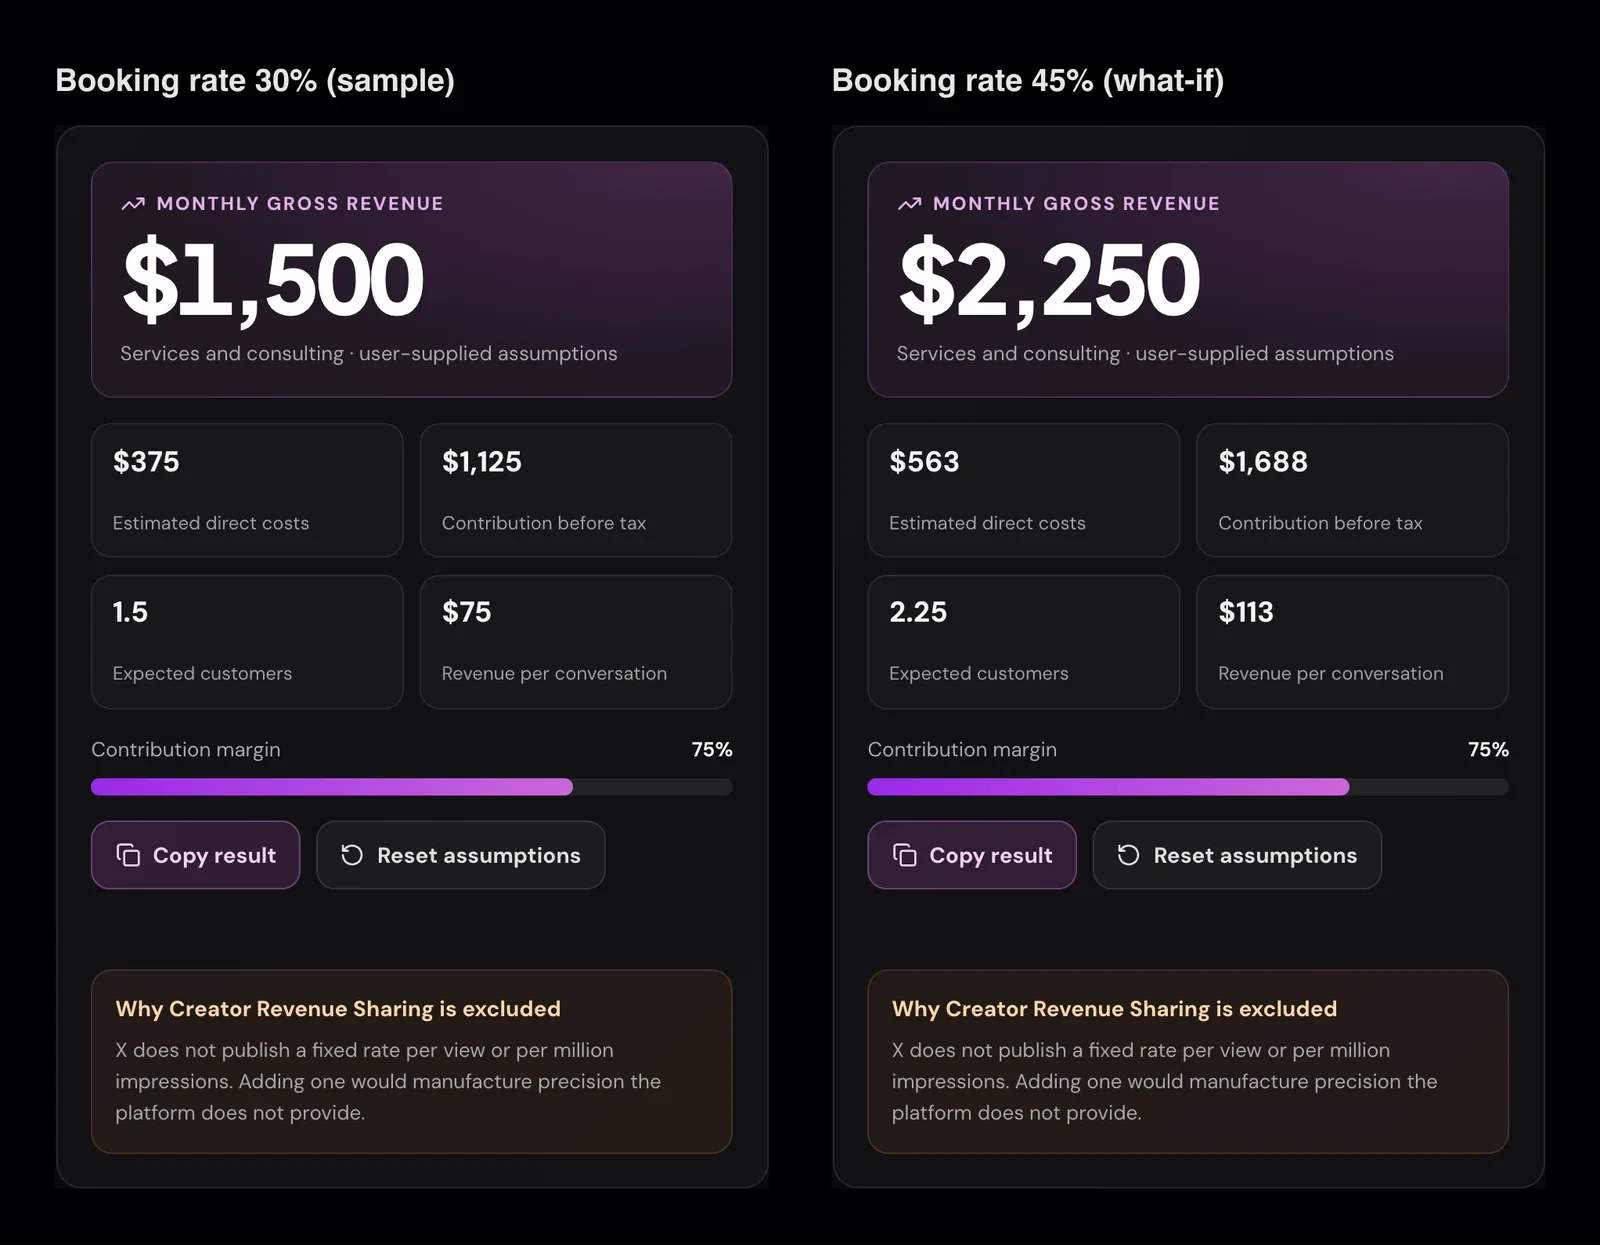
In the Services sample, 20 qualified conversations produce 1.5 customers and $1,500 a month:
- Raising the booking rate from 30% to 45% gives $2,250 (+50%).
- Raising the close rate from 25% to 40% gives $2,400 (+60%).
- Getting 50% more conversations would also give $2,250, but usually needs much more content and time.
That comparison is the whole point. Better follow-up after a conversation and a clearer offer often move revenue more than another month spent chasing reach. Because every input in a chain is multiplied, a 50% improvement anywhere has the same effect, so improve whichever step is cheapest to fix.
Worked examples for each path
Services and consulting
Example: a freelance designer gets about 20 relevant conversations a month from replies and DMs. 30% book a call, 25% of calls close, and the first project averages $1,000 with 25% going to contractors. That’s 1.5 clients, $1,500 gross and $1,125 contribution. Count only qualified conversations: people with the budget, the problem and a real need. Counting every friendly DM inflates the model.
Sponsorships
Example: two sponsored posts a month at $500 each, $75 of production per campaign and $50 a month of admin give $1,000 gross and $800 contribution. Price usage rights and exclusivity separately. A brand that wants to reuse your post in its ads is asking for more than a post. A badly matched sponsor can cost you more audience trust than the fee is worth.
Affiliate marketing
Example: 500 qualified clicks, 4% purchase conversion, $200 average order and 20% commission give 20 sales and $800 gross. With 8% of commissions reversed by refunds or rejections, contribution is $736. Read each program’s attribution window and clawback rules before you promote it. A lower commission on a product people keep is often worth more than a high one on a product they return.
Digital product
Example: 1,000 qualified visitors to a $49 product page, converting at 3%, give 30 sales and $1,470 gross. After 5% payment fees, 4% refunds and $2 of support per sale, contribution is $1,278. Before building something big, check demand with a waitlist or a small first version.
Paid newsletter or community
Example: 200 members at $10 a month is $2,000 gross. With 20 new members and 5% churn, you end the month with 210 members. Watch that ending number. Revenue can look flat while the member base slowly shrinks, and churn usually points to a gap between what was promised and what members get.
X Creator Subscriptions

Example: 100 subscribers at $5 a month is $500 gross. With a cautious 15% for deductions, contribution is $425, and 10 new subscribers against 6% churn leaves 104 at month end.
Set the price to one X actually offers you, and set the deductions from your real payout statement once you have one. X says creators can earn up to roughly 97% of gross subscription revenue, but payment-processing fees, app-store fees on purchases made in the iOS or Android apps, cancellations and refunds all come out of that. The calculator doesn’t check whether you’re eligible; Creator Studio does.
Reading your result honestly
- It’s a model, not a forecast. The output only shows what follows from your inputs. It can’t predict reach, demand, approval or what a platform will pay in the future.
- Contribution isn’t take-home pay. Your time, tools, owner salary and tax all come after it.
- One path first. Most creators who earn well from X have one main path and add others later. Stacking four half-built paths in a spreadsheet looks good and rarely holds up.
- Re-run it monthly. Replace guesses with real numbers as you get them. A model built only on measured numbers is the one worth trusting.
Your inputs and results stay in your browser. Analytics record which tab you used, never the numbers you entered.
Frequently asked questions
How much does X pay per 1,000 or 1 million views?
X doesn’t publish a rate. Its native creator payouts depend on engagement and impressions that X measures internally, so any fixed per-view figure is an estimate. Plan around revenue you control, such as services, products and sponsorships, and treat native payouts as a bonus.
Does X still have Creator Revenue Sharing?
No. X retired Creator Revenue Sharing on September 7, 2026 and replaced it with Original Content Rewards, which pays on qualified Home Timeline impressions from Premium users and checks content for originality. Eligibility and status are shown in Creator Studio.
How many followers do you need to make money on X?
For Original Content Rewards, X’s published minimum is 500 verified followers plus an impressions threshold and a Premium plan. Creator Subscriptions currently ask for 2,000 verified followers. For services, sponsorships, affiliates and products, there’s no minimum. Small, well-targeted audiences often earn more per follower than large general ones.
Does the calculator check my eligibility for X Subscriptions?
No. It models subscription revenue from the numbers you enter. Eligibility is decided by X and shown in Creator Studio.
Is my financial data saved anywhere?
No. All calculations run in your browser, and copied summaries are built locally. Usage analytics never include the numbers you type.
Is this financial or tax advice?
No. It’s an editorial planning tool. Contribution figures exclude tax and your own pay, so speak to an accountant before relying on any number for decisions.
Related guides and tools
- Twitter monetization guide: every way X pays creators and how to set each one up.
- How to make money on Twitter: ways to earn from an X audience beyond native payouts.
- Twitter Engagement Rate Calculator: check whether your posts get the engagement a sponsor will ask about.
- How much is my Twitter account worth?: what drives the value of an X audience.