You’re probably in the same spot as many others searching for a twitter analyzer tool. You’re posting on X (Twitter), getting some impressions, maybe a few replies, but growth still feels random. One post pops, three disappear, and native analytics tells you what happened without telling you what to do next. The right analyzer tool fixes that. It helps you connect post performance, audience behavior, timing, and competitor patterns so you can make better decisions before you publish, while you engage, and after results come in.
What Is a Twitter Analyzer Tool and Why Do You Need One
A twitter analyzer tool is more than a dashboard that counts likes. It’s a system for understanding what gets seen, what gets engagement, and what turns attention into follower intent.
Native X analytics still matters. It gives you a baseline. According to Agorapulse’s breakdown of Twitter analytics, the platform’s native dashboard centers account reporting around a 28-day summary with metrics like total tweets, new followers, profile views, and mentions, plus tweet-level impressions, engagements, and engagement rate. That structure shaped how most creators and marketers review short-term performance today.
The problem is that a baseline isn’t a growth system.
If you only look at your own account summary, you miss the bigger questions:
- Why did one post attract profile visits while another only got passive likes
- Which topics consistently earn replies from your target audience
- What formats your niche is rewarding right now
- Whether your account is improving over time or just bouncing around
Practical rule: If your analytics only help you describe the past, you don’t have a growth workflow yet.
A useful analyzer helps you compare periods, study post patterns, and spot opportunities before they’re obvious. That’s the difference between reporting and decision support.
If you want a broader look at the category, this roundup of Twitter analysis tools for better engagement and tweet generation is a good companion read.
The Four Core Jobs of a Modern X Analyzer
The old version of analytics was a car dashboard. You could see speed, fuel, and a few warning lights.
The modern version is closer to navigation. It doesn’t just tell you what happened. It helps you choose the next move.
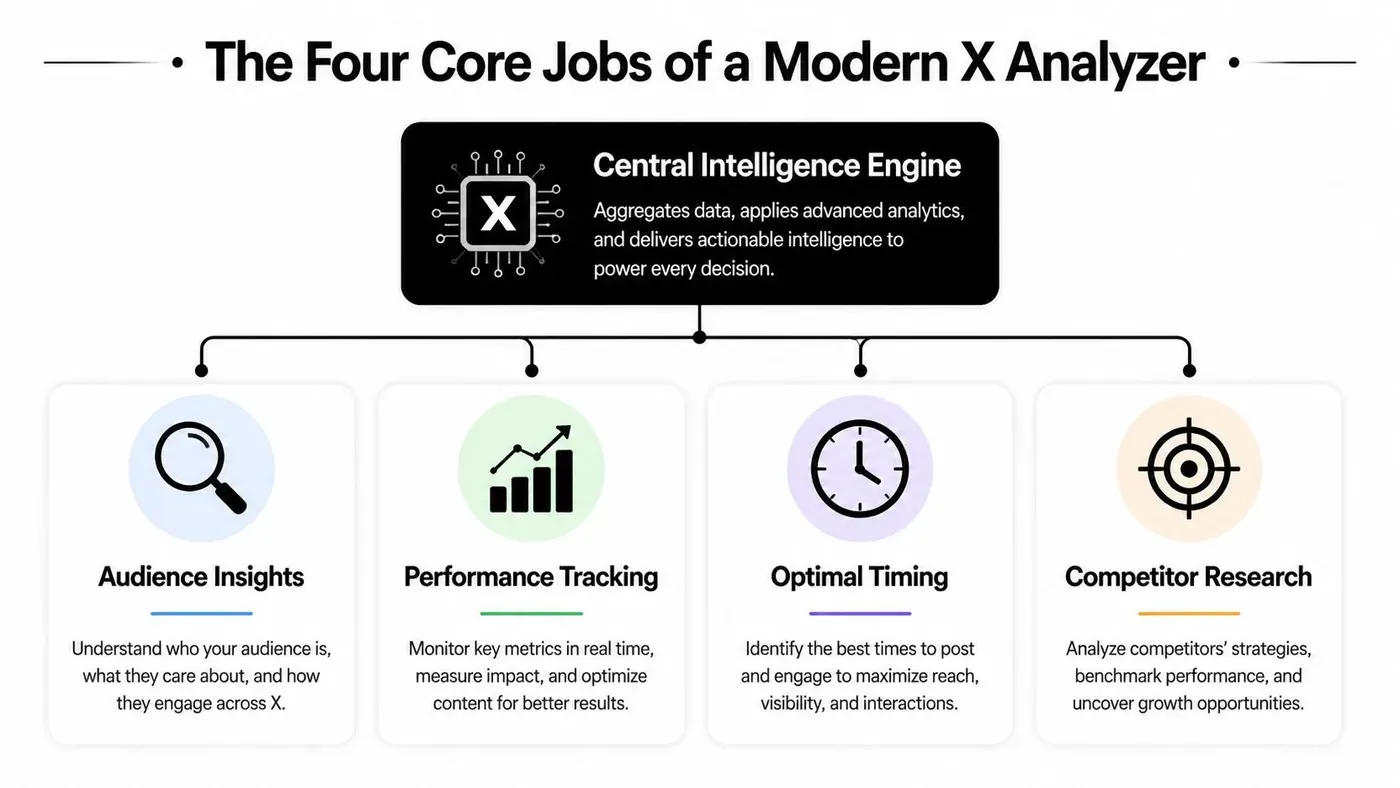
Tweet Archivist notes that Twitter analytics tools now track far more than simple post metrics. The category has expanded into multi-dimensional analysis that includes engagement, impressions, follower growth, hashtag performance, and competitor strategy. That shift matters because growth on X rarely comes from one isolated post. It comes from repeated wins across content, audience fit, and timing.
Performance tracking
This is the obvious job, but many people still use it badly.
A strong analyzer should show which posts earned impressions, which earned engagement, and which created downstream action. You want to sort posts by format, topic, hook style, media use, and posting time, not just by total likes.
What works:
- Comparing similar post types so you don’t judge a short opinion post against a launch thread
- Reviewing post-level data instead of only account-level summaries
- Tagging winners by pattern such as contrarian hooks, tutorials, visual posts, or replies turned into standalone posts
What doesn’t:
- Ranking everything by likes
- Judging a post in the first few hours only
- Changing strategy after every spike or dip
Audience intelligence
Growth gets easier when you know who’s responding.
Audience insight means understanding what kind of people engage, when they’re active, and which themes trigger action. Some tools focus more heavily on segmentation and overlap analysis. That’s useful when you need to understand not just your followers, but adjacent communities and accounts worth studying.
A creator can use this to shape voice and topic selection. A founder can use it to see whether posts are attracting peers, buyers, or random broad traffic.
The best audience insight isn’t “who follows me.” It’s “who acts when I post this kind of idea.”
Competitor benchmarking
Many creators get uncomfortable with this, but it’s one of the fastest ways to improve.
You don’t need to copy anyone. You need to identify what your market is rewarding. If three accounts in your niche are pulling strong response from tactical teardown posts while your generic advice posts stall, that’s a signal. If competitor growth lines move when they increase replies, that’s another signal.
Benchmarking is most useful when you compare:
- Topic mix
- Posting frequency
- Response style
- Top post formats
- Timing habits
Content discovery
This is the most underused job.
Analytics is often thought to start after posting. Smart growth users know it starts before posting. A modern analyzer should help you find rising conversations, recurring hooks, and high-momentum posts that are worth studying or joining.
That’s where the category starts to blend with creation and engagement tools. Some platforms stop at reports. Others help you save patterns, build reply workflows, and turn proven structures into new posts.
Key Metrics That Actually Drive Growth
Not every metric deserves equal attention. Some tell you you were seen. Others tell you you moved someone.
Sprout Social’s overview of Twitter data and metrics makes an important distinction: a robust analyzer should separate distribution metrics, engagement metrics, and conversion actions. That separation matters because impressions measure potential reach, while profile visits and new followers show whether the content created intent.
Reach is not the same as response
Here’s the simplest way to think about it.
A post can get wide distribution and still be weak for growth. Another post can get less reach but produce stronger profile curiosity, better replies, and more follower movement. If you treat those posts as equal because both “performed,” you’ll repeat the wrong format.
| Metric | What It Measures | Why It Matters for Growth |
|---|---|---|
| Impressions | How often a post was displayed | Shows distribution potential. Good for identifying hooks and formats that earn reach. |
| Engagements | Total interactions with a post | Tells you whether the post pulled people into action instead of passive scrolling. |
| Engagement rate | Engagement relative to impressions | Helps compare posts with different reach levels more fairly. |
| Replies | Direct responses to a post | Strong signal for conversation quality and network effects. |
| Profile visits | Visits to your profile after seeing content | One of the clearest signs that content created curiosity. |
| New followers | Follows gained from content activity | Indicates whether your posts convert attention into audience growth. |
| Bookmarks or shares | Save and distribution behaviors | Often signals utility, resonance, or later intent. |
| Link clicks | Visits to an external destination | Useful when the goal is traffic or action outside X. |
A practical dashboard should answer three different questions:
- Did this post travel
- Did this post get people to interact
- Did this post move people closer to following or clicking
If you only track the first one, you’ll drift toward vanity formats.
A simple dashboard that tells you what to do
For most creators and founders, a small set of metrics is enough:
- Impressions by post type
- Engagement rate by topic
- Profile visits per impression
- Follows per post
- Replies generated by original post
- Top-performing publish windows
That last point matters because timing and audience behavior are connected. If your account gets solid engagement but weak profile visits in one time slot, you may be reaching a casual audience segment rather than your highest-intent one.
A good analyzer should help you compute the ratios that reveal this. If you want a primer on reading those numbers inside a cleaner framework, this guide to Twitter analytics and what to track is worth bookmarking.
Growth lens: Don’t ask “Which post got the most attention?” Ask “Which post created the strongest chain from impression to curiosity to follow?”
Practical Workflows to Turn Analytics Into Action
On Monday, a post spikes. By Friday, nothing else from that topic moves. That is what happens when teams react to one outlier instead of running a repeatable growth process.
Useful analytics create decisions. They help you spot patterns, test ideas, and connect discovery, engagement, and publishing into one operating loop. Tweet Archivist’s best-practices guide recommends time-series comparison and enough observations to reduce noise. Use that standard here. One strong post can give you an idea. A repeated pattern earns a workflow.
Workflow one for content discovery
Start outside your own account. Early content planning gets stronger when you study what already earns attention from the audience you want.
Pick a small set of creators, founders, or operators in your niche. Review their recent top posts and sort them by repeatable structure, not topic alone. The goal is to find formats you can adapt to your expertise, audience maturity, and offer.
Look for patterns like these:
- List-style teaching posts
- Strong first-line opinions
- Mini case breakdowns
- Screenshots with commentary
- Reply-driven posts that became standalone ideas
Then build a swipe file around inputs you can reuse:
- Save posts with clear response signals.
- Label each one by hook, format, and audience pain point.
- Write a version grounded in your own experience.
- Publish a few variants and compare which structure earns replies, profile visits, or follows.
That last step matters. A pattern that performs for a big creator may fail for a smaller account if it depends on brand recognition. An analyzer helps separate “good idea” from “good fit.”
For example:
“Most founders don’t need more content ideas.
They need a system for turning replies, objections, and notes into posts.”
This structure works because it names a specific audience, points to a familiar bottleneck, and sets up a practical takeaway fast.
Workflow two for high-value engagement
Replies are often the fastest path to qualified attention, especially for smaller accounts. But random participation wastes time.
Use analytics to find conversations where three conditions overlap. The post is gaining traction, the topic matches your niche, and the audience is one you want on your profile. That gives your reply a job beyond visibility.
Check for:
- Active reply velocity
- Topical overlap with your niche
- A clear claim, question, or gap you can add to
- An audience worth attracting
Xholic AI is one tool built for that workflow. It combines tweet discovery, reply drafting, post organization, idea remixing, and scheduling. That matters if your process depends on finding timely conversations, saving strong examples, and turning good replies into future posts.
Here is the difference between low-value and high-value engagement:
Original post: “Many users on X are overcomplicating growth.”
Weak reply: “So true.”
Useful reply: “Agreed. The pattern I keep seeing is that accounts treat posting, replying, and analytics as separate jobs. Growth improves when those three run as one loop.”
The second reply gives readers a reason to click. It adds a point of view, not just agreement.
If you want a cleaner view of that operating loop, this Twitter analytics dashboard for content and engagement decisions shows how to structure it.
A quick demo can help make that workflow clearer:
Workflow three for performance optimization
Now review your own account in batches. Single-post analysis is noisy. Format-level analysis is more useful because it shows what tends to create the outcome you want.
Group recent posts by format, topic, and goal. Then compare downstream behavior. A post that gets broad reach but weak profile activity may be good for awareness and poor for conversion. A post with modest impressions but strong replies and follows is often the better growth asset.
A practical weekly review looks like this:
- Keep formats that earn engagement and profile curiosity
- Rewrite formats that get reach but weak follow-through
- Drop formats that miss across several posts
- Repackage strong replies into standalone posts or threads
Timing belongs in this review too. Schedule around audience response patterns and your own availability to join the conversation after posting. If a time slot produces decent impressions but weak replies, the issue may be timing, audience intent, or the fact that you were not present to continue the thread.
Publishing starts the test. The workflow that follows determines whether the next week gets better.
How to Choose the Right Twitter Analyzer Tool for You
The market is fragmented. That’s why choosing a twitter analyzer tool gets confusing fast.
X’s own business analytics positioning is about understanding what’s working and what isn’t for optimization, but the broader market now stretches far beyond that. As reflected in X business analytics guidance, users often end up deciding between a reporting tool, a research archive, or a discovery engine. Those aren’t the same product category, even when all of them say “analytics.”
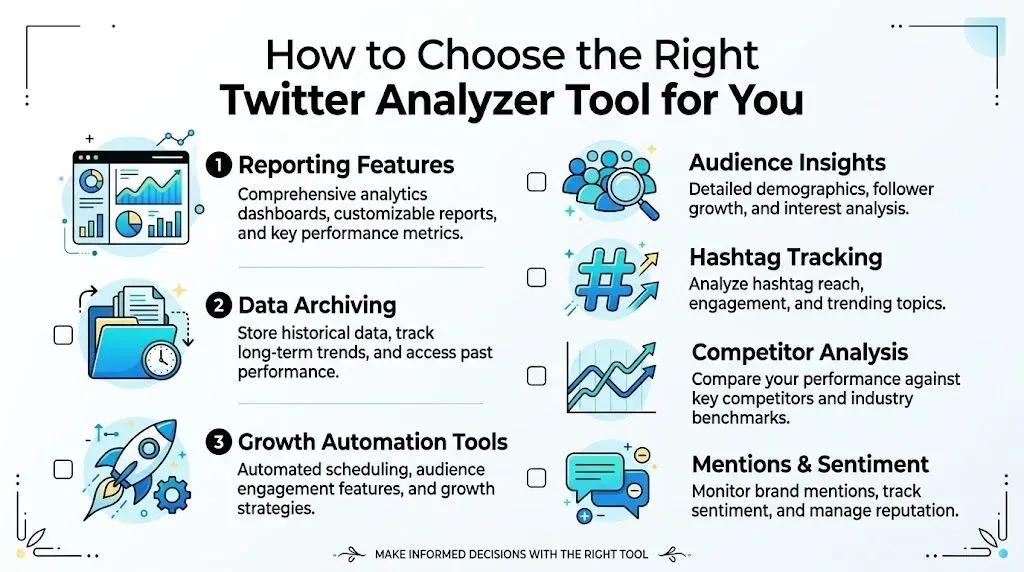
If you mainly need reporting
This is the social media manager use case.
You care about account summaries, exportable reports, post-level metrics, and clean dashboards. Native analytics can cover some of this. Third-party tools become more useful when you need historical visibility, client reporting, or easier exports.
Choose a reporting-focused tool if you spend most of your time answering:
- How did this account perform
- Which posts were top performers
- How do I summarize the last reporting window
If you mainly need research
This fits agencies, analysts, and teams doing audience or conversation analysis.
You need public-account analysis, archives, search depth, hashtag tracking, or long-range trend review. In this case, the key question isn’t just dashboard quality. It’s data retention and retrieval.
Look closely at:
- How far back the tool can analyze
- Whether it supports public account research
- How easy it is to export, save, and compare findings
If you mainly need growth execution
This is the creator, founder, and indie hacker use case.
You don’t just want to know what happened. You want to find better topics, join stronger conversations, save ideas, write faster, and build a repeatable posting rhythm. In that case, a static dashboard won’t do much on its own.
Prioritize tools that support:
- Discovery before posting
- Reply and content workflows
- Saved collections and research organization
- Chrome extension support
- Scheduling tied to actual publishing habits
If you’re comparing lightweight options first, this list of free Twitter analytics tools can help narrow the field.
Common Mistakes to Avoid When Analyzing Your X Account
A good tool won’t save you from bad reading habits.

Mistake one chasing vanity wins
A post with a lot of likes can still be weak for growth.
Best practice:
- Track downstream behavior such as profile visits, replies, and follows, not just surface engagement
- Judge formats by repeatability because one flashy post can distort your view
Mistake two reading posts without context
A short post, a thread, a meme, and a launch announcement don’t deserve the same benchmark.
Best practice:
- Compare like with like by grouping posts into format and intent
- Include timing and audience context before deciding a topic “works” or “doesn’t work”
Most bad analytics decisions come from comparing things that were never comparable in the first place.
Mistake three checking data without a system
People either obsess over every post or ignore analytics for weeks. Both are bad.
Best practice:
- Use a fixed review rhythm so you can spot patterns
- Write down actions after each review such as doubling down on a hook type, changing timing, or testing more direct replies
Mistake four confusing noise for insight
X is volatile. A random spike can tempt you into rewriting your whole strategy.
Best practice:
- Wait for repeated evidence
- Review groups of posts over time
- Treat short-term swings carefully instead of overreacting
Frequently Asked Questions About X Analyzer Tools
Is a free twitter analyzer tool enough
It’s enough to start. It usually isn’t enough for serious growth workflows once you need deeper comparisons, discovery, or content operations.
How often should I check X analytics
Check lightly after posting, then review in batches on a fixed cadence. Daily obsession usually leads to bad decisions.
Can a twitter analyzer tool guarantee follower growth
No. It can improve decisions, reveal patterns, and reduce guesswork. Growth still depends on posting quality, relevance, replies, and consistency.
What should I look at first
Start with impressions, engagement rate, profile visits, replies, and new followers. Those give you a practical view of reach, response, and conversion.
If you want one place to handle discovery, reply writing, content remixing, saved research, consistency tracking, Chrome extension workflows, and scheduling, try Xholic AI. It’s built for people who want analytics to lead to action, not just another report.