You’re posting on X (Twitter), seeing views tick up, and still wondering whether anything is working. That’s the normal starting point. The fix is simple: check the right analytics surface for your account type, then read the numbers in context instead of staring at them in isolation.
If you want to know how to see twitter analytics, there are two practical routes. You can use the main analytics dashboard if your account has access, or you can open any individual post and tap the bar-chart icon to see post-level data. Both matter. One shows account patterns, the other shows what a specific tweet did. If you want more depth after this guide, Xholic’s analytics articles cover related workflows.
Your Guide to X (Twitter) Analytics
The initial requirement isn’t usually more content advice. What’s needed is visibility into what already happened. If a post gets attention, you want to know whether it brought profile visits, replies, reposts, or just empty impressions.
X gives you two levels of analytics. The main dashboard is where you review broader account performance. The post-level view is where you inspect one tweet at a time. That split matters because a creator on mobile often sees analytics differently than a premium user working on desktop.
Practical rule: Don’t start by asking “Did this go viral?” Start by asking “What action did this post cause?”
The most useful workflow is straightforward:
- Check the post first if you want immediate feedback.
- Use the dashboard for trend review and exports if your account has access.
- Compare posts by format, topic, and hook, not just by raw views.
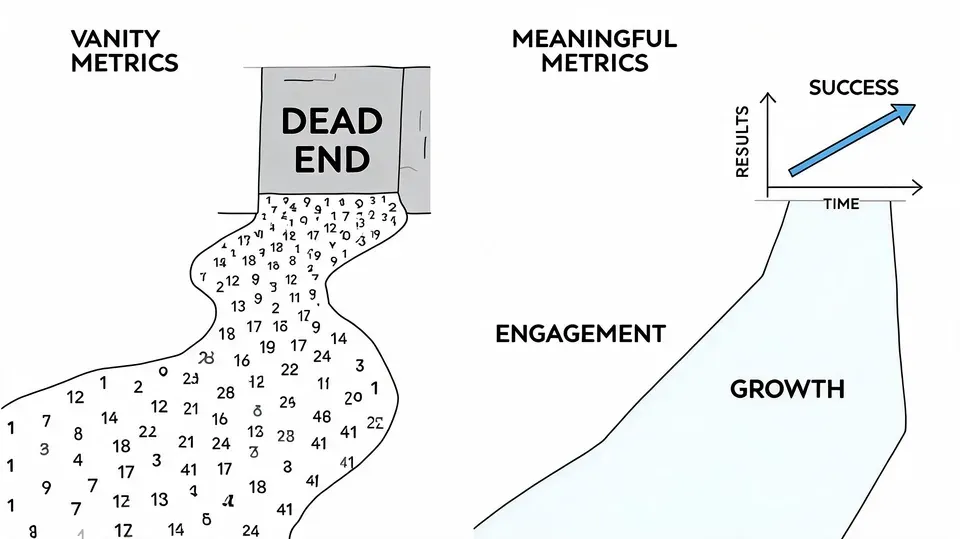
That’s how analytics becomes a growth tool instead of a vanity ritual.
Accessing the Main X Analytics Dashboard
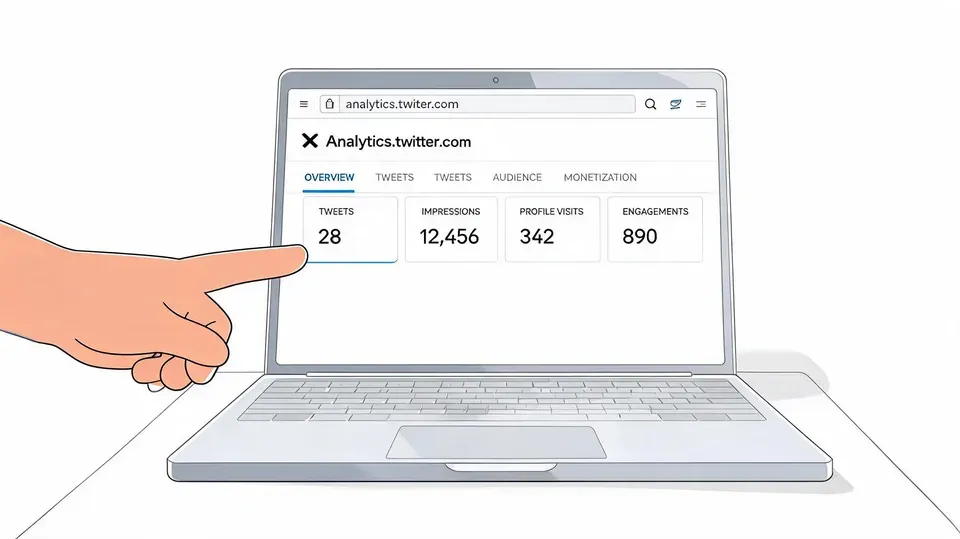
You post all week, one thread clearly outperforms the rest, and now you need the account-level view. The main dashboard is where you check whether that lift stayed isolated to one post or affected profile visits, follower growth, mentions, and overall reach across the account.
Access depends on account type and device. Premium users working on desktop usually have the clearest path to the full dashboard. Free users often find that post-level analytics are easier to access consistently, especially on mobile. That distinction matters because the dashboard is built for trend review, exports, and pattern spotting, not quick checks on a single post.
What you need before the dashboard appears
Two constraints cause a lot of unnecessary troubleshooting.
First, newer accounts may not show analytics right away. Tweet Archivist’s guide to checking Twitter analytics notes that an account needs to be active for a period before analytics data becomes available. Second, native retention is limited, so older data may roll out of view unless you export it or save your own records.
Treat the dashboard like a working report, not a permanent archive.
That changes the workflow:
- New account: give the platform time before assuming access is broken.
- Premium or desktop-heavy workflow: use the dashboard for weekly review and exports.
- Free or mobile-first workflow: rely more on post analytics, then log standout results separately if you want trend history.
- Campaign tracking: save snapshots while the data is still available.
What to look at inside the dashboard
The value of the main dashboard is context. A single post can look strong in isolation and still fail to drive follower growth, profile interest, or repeat engagement across the rest of the account.
X’s native dashboard is commonly organized around three practical views: Account Home, Tweet Activity, and Videos. Use them for different decisions, not just different screens.
| Area | Best use | What to check |
|---|---|---|
| Account Home | Weekly account review | Overall visibility, profile visits, mentions, and follower movement |
| Tweet Activity | Content comparison | Which hooks, formats, and posting times produced stronger engagement |
| Videos | Format-specific review | Whether video posts are holding attention better than text or image posts |
Here’s the workflow I use with junior social teams. Start on the summary view and look for movement, not just spikes. If impressions rise but profile visits stay flat, the content got distribution without creating enough curiosity to earn the next click. If engagement rate is healthy on a small post, the topic may deserve a stronger hook or a repost at a better time.
Then move into tweet activity and compare posts by format, topic, and intent. A meme post might win on reach and still be less useful than a niche opinion post that brings replies, saves, profile visits, or link clicks. The dashboard helps you separate attention from outcomes.
If you want to see the dashboard flow in action, this walkthrough is useful before you start clicking around:
A simple review rhythm works well. Open the dashboard, scan the summary, flag the posts that changed account behavior, and export anything you may need later. That habit matters more than checking the numbers every hour.
Checking Individual Post Analytics on Mobile and Desktop
For many users, this is the practical answer to how to see twitter analytics. You don’t need the full dashboard to inspect a single post. You just need the post itself.
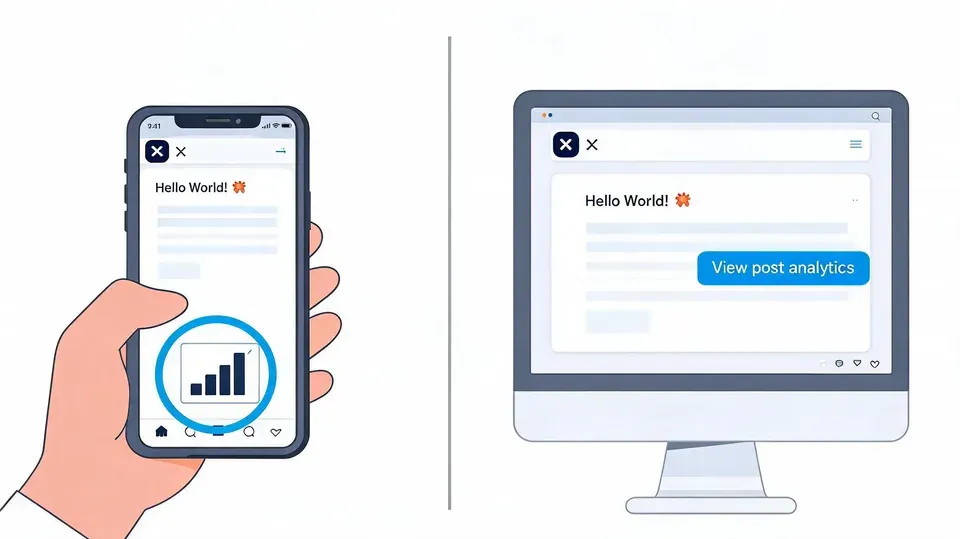
The fastest way for free accounts
On both desktop and mobile, open an individual tweet and tap or click the bar-chart icon. For free accounts, that’s often the most reliable native analytics view. Paid or Premium accounts may also get the broader dashboard, but for many users, especially on mobile, post-specific analytics is the surface they’ll use most often. That workflow is described in Tweet Archivist’s guide to using Twitter analytics.
On mobile, this matters even more. The app is mainly built for quick checks on specific posts rather than deep account analysis.
Here’s what you’ll usually inspect at post level:
- Impressions tell you how many times the post was shown.
- Engagements show total interactions around the post.
- Profile visits help you see whether the post created curiosity.
- Link clicks matter if the post had a destination.
- Replies and reposts show whether people felt like participating, not just viewing.
If you’re checking from your phone, assume the job is diagnosis, not reporting. Mobile is best for quick post checks.
A simple post review example
Say you publish this post:
“Most founders don’t need more ideas. They need a repeatable posting system.
Post one insight, one proof point, and one opinion every day.”
You open the post a few hours later and inspect the pop-up analytics. Don’t ask only whether the impressions look good. Ask what happened after people saw it.
Use this reading order:
- Start with impressions. Did the post get distributed at all?
- Check engagements next. If impressions are decent but engagement is weak, the hook probably didn’t earn enough action.
- Look at profile visits. If people visited your profile, the topic likely matched your positioning.
- Review replies and reposts. Those are stronger signals of resonance than passive scrolling.
- Check link clicks only when a click was the goal. A no-link post should not be judged by traffic behavior.
A desktop review is slightly easier because you can compare several posts faster. A mobile review is better for in-the-moment checks right after posting. Use both if you manage content actively.
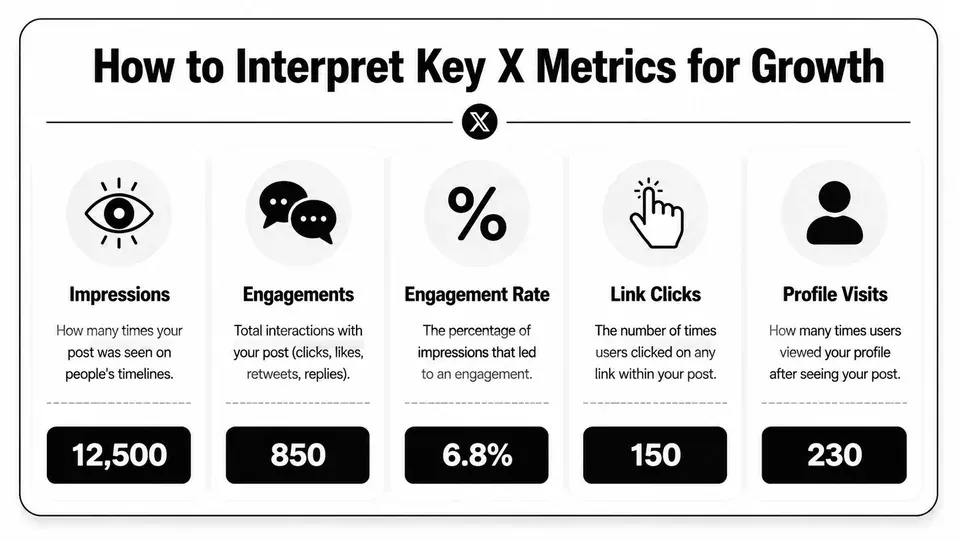
How to Interpret Key X Metrics for Growth
You post something that gets plenty of reach, but nothing happens after the view. No replies. No profile interest. No follows you can trace back to it. That is the point where analytics becomes useful. The job is to separate posts that were merely seen from posts that moved someone closer to your goal.
Free users and premium users often read the same metrics differently because their workflow is different. If you are on mobile or checking a single post, you are usually diagnosing performance. If you have broader account-level visibility, you can compare patterns across posts, time periods, and formats. In both cases, the question stays the same. What should this number change in your next draft?
What each metric is really telling you
A metric only matters if it maps to a behavior you can act on.
- Impressions show distribution. The post reached feeds, search, or recommendation surfaces.
- Likes show low-friction approval. Nice to have, but they rarely tell you why a post worked.
- Replies show conversation pull. The post gave people something to add, question, or challenge.
- Reposts show share value. People decided the idea was worth passing to their own audience.
- Quote posts show interpretation. Your post triggered commentary, agreement, disagreement, or reframing.
- Engagement rate shows efficiency. It helps you judge whether exposure turned into action at a healthy rate.
The common reading mistake is simple. Teams see high impressions and assume the post was strong. Sometimes it was only well distributed.
Use this table as a working guide:
| Metric | What it usually means | What to do if it’s strong |
|---|---|---|
| Impressions | The topic or opening line earned reach | Reuse the hook style, timing, or subject angle |
| Replies | The post created enough tension or relevance for discussion | Write follow-up posts and answer comments to extend the thread |
| Reposts | The idea felt useful, memorable, or identity-driven | Turn it into a series, graphic, or thread |
| Profile visits | People wanted context about who you are | Improve your bio, pinned post, and recent post mix |
| Engagement rate | The post converted attention into action efficiently | Study the structure closely, including hook, format, and clarity |
High impressions with weak downstream action usually means the packaging worked better than the substance. Low impressions with strong engagement often means the post deserves a second version with a stronger opening.
Turn metrics into decisions
Successful teams distinguish vanity reporting from strategic content planning. They do not ask whether a post was “good.” They ask what job it did.
A short opinion post might earn reach and reposts because it is easy to react to. A tactical post might get fewer impressions but more profile visits because it attracts the right audience. A debate-style post might pull replies but very few clicks. Those outcomes are not equal, and they should not lead to the same decision.
Use a simple review framework:
- Match the metric to the post goal. If the post was meant to build authority, profile visits matter more than likes.
- Compare by format. Threads, short text posts, memes, and clips should not be judged on the same baseline.
- Log three tags for every winner. Track the topic, format, and hook style.
- Look for repeatable patterns. One strong post is interesting. Three strong posts with the same structure is a playbook.
- Adjust the next batch quickly. If a framing style keeps producing replies or profile interest, use it again within the next few posts.
This matters even more when different team members are checking different surfaces. A creator on a free account may rely on individual post signals and a manual tracking sheet. A premium user or manager reviewing broader analytics can spot category-level patterns faster. The workflow changes, but the decision logic does not.
If you want a reference point for building that review process, this Twitter analytics workflow guide is a useful companion to your post-by-post checks. The value comes from turning recurring signals into a content system, not from staring at isolated numbers.
Keep a record of your best-performing posts. Next to each one, write the likely reason it worked. That habit improves strategy faster than collecting screenshots of wins with no explanation.
Common Mistakes and Analytics Best Practices
You pull up yesterday’s posts, see one with big impressions, and assume it won. Then you check the account later and realize it drove almost no profile visits, follows, or useful replies. That is the mistake this section helps prevent.
Raw numbers only help if they change what you publish next. For free users, that usually means checking post-level analytics and logging results manually. Premium users and team leads can review broader patterns faster, but the same rule applies. Judge performance by what the post was supposed to do.
Mistakes that waste time
The most common error is treating reach as proof of progress. Impressions show distribution. They do not prove that the post built authority, started conversation, or turned viewers into followers.
Another mistake is reviewing posts without context. A meme, a product update, and a thread should not compete on the same baseline. If you compare everything together, your reporting gets noisy and your next content decisions get worse.
Watch for these patterns:
- Overreacting to one post: one spike or drop rarely reflects the actual trend.
- Using the same benchmark for every format: short text posts, threads, clips, and quote posts produce different engagement patterns.
- Reading results too early: some posts pick up later through reposts, replies, or quote tweets.
- Skipping notes: if nobody records the likely reason a post worked, the team has nothing useful to repeat.
Good analytics habits improve the next draft, not just the weekly report.
Best practices that help
Use analytics as a content review system, not a scoreboard.
Start with small tests you can explain later. Change the hook, not the topic. Change the format, not the offer. If a short opinion post gets replies but a thread on the same subject gets profile visits, those posts did different jobs. Treat them that way.
A practical workflow looks like this:
-
Review by batch, not by mood
Look at posts from the same week or campaign window. Patterns show up faster when you compare a group instead of chasing one winner. -
Separate workflow by access level
Free users should track post-level metrics in a simple sheet. Premium users can use broader account analytics to spot format and topic trends faster. Different tools, same decision process. -
Tie each metric to an action
More replies suggests the topic invites conversation. More profile visits suggests the framing builds interest. More link clicks suggests the call to action is clear enough to repeat. -
Pre-plan what you want to learn
Do not publish five completely different ideas and call it testing. Decide whether you are testing hook style, topic, format, or posting window.
If audience growth is the goal, pair your analytics review with a repeatable follower strategy. Xholic’s guide on how to get followers on Twitter works well alongside your weekly metric review because it connects post performance to follower growth, not just engagement.
One more best practice matters on busy teams. Write down the takeaway immediately after review. A short note like “strong replies from contrarian hook” or “high impressions, low profile interest” is enough. That record becomes far more useful than a folder full of screenshots.
Frequently Asked Questions About X Analytics
Why can’t I see my X analytics?
The most common reason is account age or access level. Some users expect analytics immediately, but native analytics access doesn’t appear right away for new accounts. If your account is still new, that may be the issue. If you’re on mobile, remember that many users mainly get post-level analytics there rather than a full account dashboard.
Can I see another person’s Twitter analytics?
Not their private native dashboard. X’s built-in analytics are tied to the account owner. You can still inspect public signals on someone else’s posts, such as replies, likes, reposts, and quote tweets, but that isn’t the same as seeing their private analytics panel.
How do I see analytics for one tweet on my phone?
Open the tweet and tap the bar-chart icon under the post. That’s the standard mobile workflow for checking post-level performance.
What’s the most important metric to watch?
It depends on the job of the post. For broad resonance, engagement rate is useful. For positioning, profile visits are often revealing. For conversation, replies matter more than passive likes.
Is the dashboard enough for long-term reporting?
Not by itself. Native retention is limited, so regular exports or records matter if you want to compare campaigns, seasons, or content themes over a longer period.
From Data Points to Growth Strategy
Seeing analytics is the easy part. Using them well is what separates random posting from deliberate growth.
The practical workflow is simple. Use the main dashboard when your account has access and you need account-level review. Use post analytics when you want immediate feedback on a specific tweet, especially on mobile. Then read each metric for what it signals: visibility, curiosity, conversation, shareability, or action.
That feedback loop should shape what you publish next. Keep the formats that earn meaningful response. Rewrite the hooks that attract views but no engagement. Archive your findings before native history disappears. If you want to go deeper into tracking options, Xholic’s roundup of free Twitter analytics tools is a useful next read.
If you want to do more than check numbers, try Xholic AI. It’s an AI-powered X growth toolkit built for finding high-momentum posts, generating replies, remixing proven tweet structures, organizing saved research, and planning content with a tighter workflow. It also includes tools for mockups and reply-chain planning, which can help when you’re shaping posts before they go live.