
Stop guessing why one post takes off and the next one dies. If you want twitter analytics free options that help you grow on X (Twitter), start with the tools that show what your audience did, not the tools that just look impressive in a dashboard. The best stack usually starts with X’s native analytics, then adds one or two free tools for scheduling, competitor checks, follower quality, or campaign snapshots.
This list keeps it practical. You’ll get the best free Twitter analytics tools, what each one does well, where each one falls short, and how to use them without wasting time. I’m also going to show you which metrics matter before you start measuring, because many users track everything and learn nothing.
1. X/Twitter built-in Analytics (Post Activity Dashboard + Video Activity Dashboard)
If you use only one tool, use X’s own analytics first. It’s the baseline because it’s first-party data from the platform itself, and it’s free to access through X analytics.
Twitter’s native analytics launched in 2014, and it opened free performance tracking to all account holders. That mattered because it gave users access to impressions, engagements, profile clicks, link clicks, video views, follower growth, date filters, and CSV export without paying for a separate platform, as noted in this overview of free Twitter analytics tools.
How to use it properly
Many users open the dashboard, glance at impressions, and leave. That’s not enough. Use it in a repeatable sequence:
- Start with post-level analytics: Open your recent posts and check impressions, total engagements, engagement rate, profile clicks, and link clicks.
- Sort for patterns: Look for repeated winners by format. Short text posts, image posts, videos, threads, and replies often perform differently.
- Export the CSV: Native export gives you room to build your own tags like topic, hook type, CTA, or whether the post was educational, personal, or promotional.
- Review follower movement: Watch daily and weekly changes so you can tie content spikes to audience response.
Practical rule: Don’t judge a post only by impressions. A post with modest reach but strong profile clicks or replies can be more valuable than a broad, low-intent post.
What works and what doesn’t
What works is accuracy on your own account. This is still the cleanest way to understand what happened on your posts, especially if you want to improve hooks, media choices, and posting cadence. If you need help turning those signals into a posting strategy, this Twitter engagement playbook is a useful next step.
What doesn’t work is competitor research. Native analytics won’t give you detailed insight into other accounts, and that’s where people usually start looking for extra tools.
2. Typefully (free plan)
Typefully is one of the better choices when you want writing, scheduling, and analytics in the same place. It feels like a creator tool first, which is why many solo operators stick with it.
The appeal isn’t just cleaner charts. It’s that you can publish, review performance, and revise future drafts without jumping between five tabs. That saves more time than most “advanced analytics” tools.
Best use case
Typefully is a strong fit if your workflow looks like this: write draft, schedule, check performance, rewrite the next version. It works especially well for people who care about post-level trends and don’t need a huge enterprise dashboard.
A practical setup looks like this:
- Write variations of the same idea: Test two hooks across separate posts.
- Track core post metrics: Focus on impressions, engagements, and engagement rate after publishing.
- Use exports when needed: Pull CSVs if you want to tag post themes manually.
- Separate accounts cleanly: If you manage more than one brand or persona, social sets help keep analytics views from getting messy.
Trade-offs
Typefully is better than native X analytics when your bottleneck is workflow, not raw data access. It’s easier to move from insight to action because the writing environment is part of the product.
It’s weaker if you want deep audience intelligence or unusual account research. It’s also not where I’d go first for public-profile analysis.
If your real problem is “I know my posts underperform, but I don’t know what to write next,” analytics alone won’t fix it. You need a writing loop tied to your data.
For a simple mental model, learn what impressions on Twitter actually mean before you overreact to every chart.
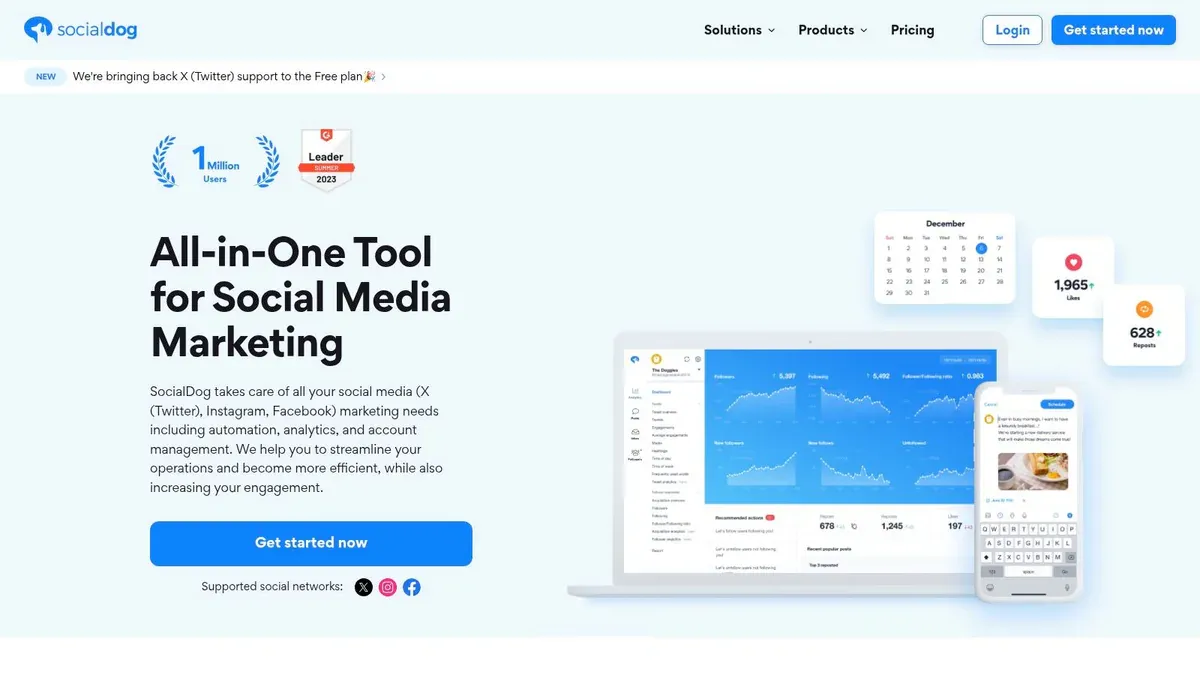
3. SocialDog (free plan)
SocialDog is the practical middle ground. It combines basic analytics, scheduling, and follower management in one free starter plan for a single X account.
That makes it useful for creators who aren’t trying to build a massive analytics stack. If you just want to post consistently and keep an eye on basic movement, it covers the essentials.
Where it fits
SocialDog is good for the operator who wants one lightweight dashboard for weekly review. The free plan supports one X account and gives you short-lookback analytics plus basic follower tools.
That short history is the key limitation. If you post actively and want to study longer trends, you’ll outgrow it. It’s still useful as a free command center for a single account.
Good workflow for beginners
Here’s where SocialDog earns its spot:
- Check posting consistency: Did you publish on the days you planned?
- Review short-term movement: Compare recent posts while they’re still fresh.
- Use follower tools carefully: Look for obvious changes in who follows back or drops off.
- Pair with native analytics: Use X’s first-party dashboard for deeper per-post accuracy.
A useful habit is to review SocialDog for cadence and account maintenance, then confirm actual post performance inside native X analytics. That gives you a cleaner split between “Did I publish?” and “Did the post work?“
4. Fedica (formerly Tweepsmap) free tier
Fedica is what I’d call the audience-analysis option. If your main question is “who follows this account and what kind of audience is building around it,” Fedica is more interesting than a plain content dashboard.
It’s broader than many solo creators need, but that’s also its edge. You can get into follower intelligence, audience geography, topic research, and account study in a way most free publishing tools don’t handle well.
What it does best
Fedica is useful when content performance alone isn’t enough. That usually happens for founders, niche brands, or researchers who need to understand audience pockets and overlap, not just likes and replies.
Use it when you want to answer questions like:
- Who am I attracting: Is your audience aligned with the niche you want?
- What topics cluster together: Are followers reacting to one theme more than another?
- Which public accounts are worth studying: Public-profile research can help identify content angles and audience expectations.
- Whether audience quality looks off: Suspected bot indicators and audience mapping can surface early warning signs.
The real trade-off
Fedica gives you more depth, but it also asks more from you. If you only care about your last ten posts, this will feel heavy. If you care about account positioning, audience composition, and public-profile analysis, it’s more valuable.
This is one of those tools where the wrong user quits after ten minutes, and the right user builds a much smarter content strategy from it.
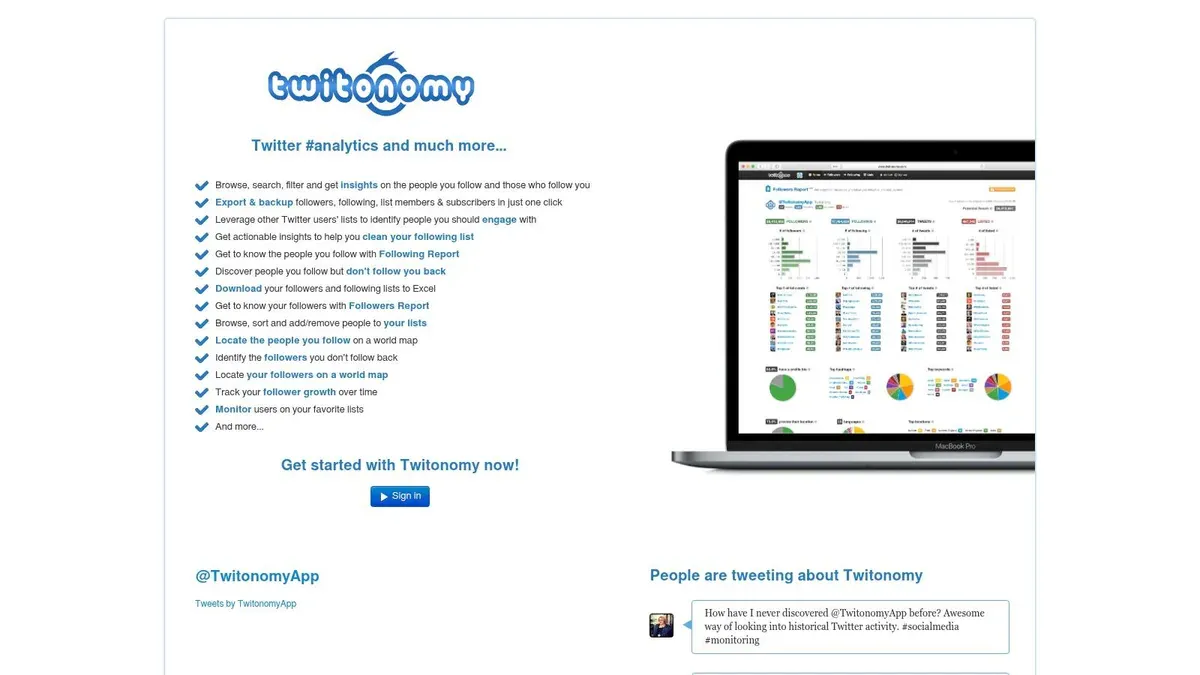
5. Twitonomy (free with optional premium)
Need a quick way to study how an X account behaves without paying for a full social suite? Twitonomy is still one of the cleaner options for that job.
It has an older interface, but the tool stays useful because it focuses on the basics that matter in early analysis. Posting patterns, mention habits, hashtag usage, retweet mix, and follower relationships are easy to scan in one place. That makes it a practical fit for the measurement stage of a growth workflow, before you start optimizing content themes or testing a follower growth plan on X.
Where it fits best
Twitonomy works well for account audits and pattern spotting. I use tools like this when I want fast answers to questions such as:
- Are posts clustered at random times, or is there a repeatable publishing rhythm?
- Does the account rely too heavily on replies or retweets instead of original posts?
- Which hashtags show up often enough to count as a real content theme?
- Are mentions pointing to genuine community interaction or just scattered tagging?
That is different from what you get in X’s native analytics. Native tools are better for owned-account performance metrics like impressions and engagement rate. Twitonomy is better for behavior analysis and public-profile review.
The real trade-off
Twitonomy is useful for directional research, not precision reporting.
If you manage your own account, start with X’s built-in dashboards for first-party metrics. Then use Twitonomy to examine posting habits, compare account behavior, or pressure-test whether your content strategy matches what you say you are doing. For competitor research, treat the output as a behavioral read, not a full measurement system.
The trade-off is simple. You get faster account-level pattern analysis, but you give up some polish and some depth that newer platforms provide. For creators, consultants, and small teams doing manual research, that can still be a fair deal.
6. Tweet Binder (free hashtag/account report)
Tweet Binder is the campaign snapshot tool in this list. I don’t use it as an always-on dashboard. I use it when I need a quick read on a hashtag, event window, keyword, or account burst.
That distinction matters. Tweet Binder is strongest when you want a report fast, not when you want a full long-term growth system.
Best use case
The free report lets you analyze up to 200 tweets from the last 7 days, with a quick counter up to 500. That makes it useful for launches, spaces, product announcements, conference hashtags, or short campaign reviews.
Use it when you need answers like:
- Which accounts drove the conversation
- Which posts got the most visible engagement
- Whether a hashtag had enough activity to justify repeating
- How a campaign looked during a short, defined period
Important warning
Tweet Binder’s reach and impression numbers are estimates, not first-party measurements. That means they’re useful for relative comparisons inside the report, but they shouldn’t replace your own account analytics.
Don’t use estimated campaign reach to judge your own content quality. Use it to understand conversation shape.
If you run events or trend-driven campaigns, this tool is often enough to tell you whether a hashtag had real traction or just felt busy in your feed.
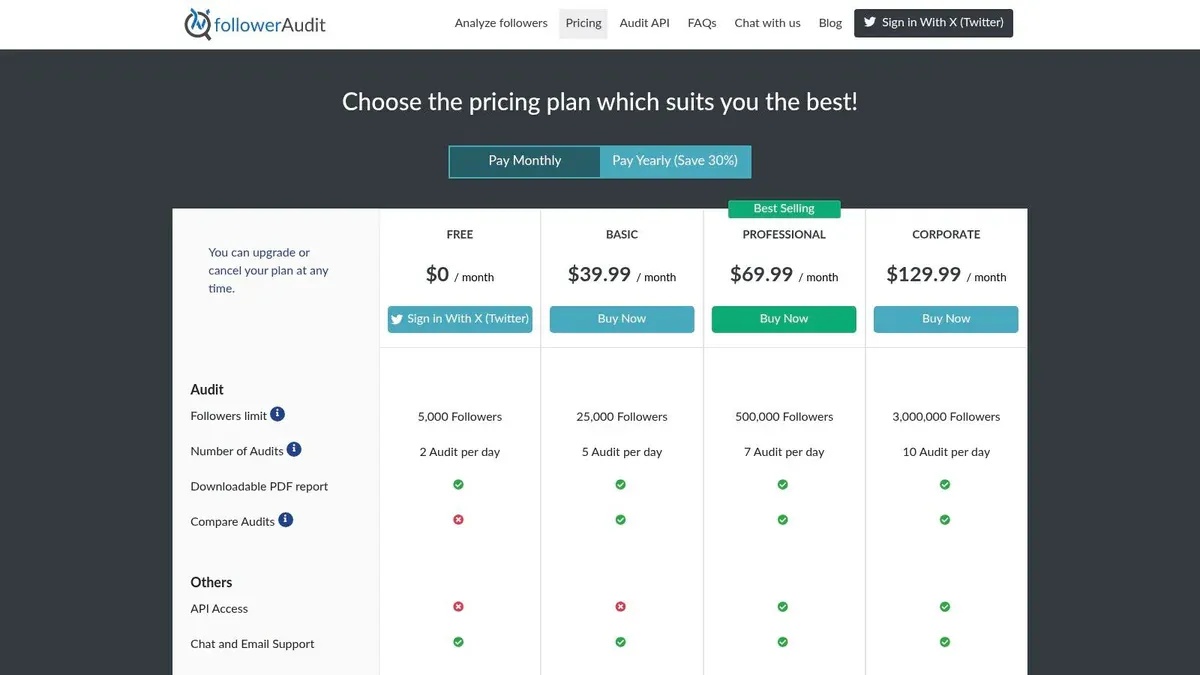
7. FollowerAudit (free fake-follower audit)
FollowerAudit solves a different problem. It doesn’t tell you which post had the best hook. It tells you whether your audience looks healthy.
That matters more than many creators think. An account can show decent surface engagement and still have a weak follower base filled with inactive or low-quality accounts.
When to use it
Use FollowerAudit if you’re in any of these situations:
- Preparing for sponsorships: Brands often care about audience quality, not just size.
- Cleaning up growth strategy: If your follower count rises but posts don’t get stronger response, quality may be part of the problem.
- Reviewing old acquisition tactics: Giveaway-driven or viral-follower spikes can leave behind weak audience segments.
- Benchmarking creator partnerships: If you’re vetting collaborators, follower quality matters.
What it tells you and what it doesn’t
The free plan allows limited audits, and full detail usually requires paid access. Beyond this, authenticity scoring is heuristic. It’s an estimate based on signals, not a final judgment handed down from the platform.
Still, this kind of audit is useful because follower growth by itself can be misleading. If you’re focused on building a better account, not just a bigger one, pair audience-quality checks with stronger content systems like this guide on how to get followers on Twitter.
8. Livecounts.io X Live Follower Counter (free)
Livecounts.io’s X follower counter is stripped down in the best possible way. No login, no setup, no dashboard maze. Type a handle, watch the follower count.
That simplicity makes it useful during live moments. Product launches, interviews, media hits, viral posts, event appearances, or creator collaborations often produce quick follower movement, and this tool lets you monitor that without opening native analytics.
What it’s good for
This is a monitoring utility, not a deep analytics platform. It works well for:
- Watching campaign spikes in real time
- Comparing two public profiles side by side
- Checking whether a big post produced actual follower movement
- Embedding a follower display for presentations or live pages
What it won’t tell you
You won’t get engagement breakdowns, top posts, or first-party reach data. It also depends on public refresh access, so visibility may be less precise than your own account dashboard.
I like tools like this because they answer one question quickly. Did this moment move the number or not? That’s often enough to decide whether something deserves deeper analysis.
9. SuperX Free X/Twitter Profile Analytics
SuperX tools are useful when you want a quick no-signup scan of a profile. That includes profile analytics, audits, follower counters, and a handful of lightweight utilities.
This kind of tool is best for rough competitive snapshots. It’s not where you build your main reporting habit, but it is where you can quickly inspect public accounts without connecting anything.
How to use it without fooling yourself
Public-profile analytics tools are tempting because they look fast and objective. The catch is that many metrics are estimates derived from public data rather than first-party numbers.
That means SuperX is best used for directional questions:
- Which public posts appear to be doing well
- How active an account seems
- Whether a profile looks healthy at a glance
- Which content formats show up repeatedly in top posts
Smart use case
I’d use SuperX to shortlist accounts worth studying, then manually inspect those accounts on X. Once you spot repeatable patterns, you can turn them into your own drafts.
That’s where examples help. Studying public winners is useful only if you can translate them into a better post structure, hook, or angle, which is why collections like these tweet examples that actually work are often more actionable than another dashboard.
10. Max Intel Twitter/X Account Analyzer (free bookmarklet)
Max Intel’s Twitter/X analyzer belongs in the niche-hacks bucket, not the main analytics stack. It runs as a browser bookmarklet and reads the live page you already have open on X.
That setup matters for one reason. It works from visible on-page data, so you can inspect public accounts without logging into another dashboard or connecting your own profile.
Where it fits
Use Max Intel when the job is fast account research, not ongoing measurement. It helps answer practical questions such as: How often does this account post? What formats show up most? Which visible posts attract replies or reposts relative to the rest of the feed?
Those are useful inputs early in a growth workflow. Before you measure your own account in native analytics, you often need a rough sense of the category, the competitors, and the posting patterns worth testing.
What it does well
Max Intel is useful for:
- Checking posting cadence on a public profile
- Scanning visible engagement patterns across recent posts
- Reviewing content mix, including replies, reposts, media, hashtags, and mentions
- Running local, no-login analysis in your own browser session
The trade-off is simple. You only get what is loaded and visible on the page, and you are not getting first-party metrics like impressions, reach, or saves from another account.
That means this tool is best for pattern spotting, not reporting.
How I’d use it
Open a competitor or peer account on X. Run the bookmarklet. Then look for a few repeatable signals instead of trying to turn the output into a polished report:
- Posting frequency: Are they posting in bursts or on a steady schedule?
- Format bias: Do top visible posts skew text-only, image, video, or reply threads?
- Engagement shape: Are replies strong but reposts weak, or the reverse?
- Conversation strategy: Are they broadcasting, replying, or quote-posting their way into reach?
If you want precise performance data on your own account, use X’s built-in analytics first. If you want a quick public-account read without adding another SaaS tool, Max Intel is a practical workaround.
Top 10 Free Twitter/X Analytics Tools Comparison
| Tool | Core features / capabilities | UX / quality | Value / price | Target audience | Unique selling point |
|---|---|---|---|---|---|
| X/Twitter built-in Analytics (Post & Video) | Post and video metrics, impressions, engagements, retention, per-post detail | 5/5 | Free, first-party | All account owners, marketers, analysts | First-party accuracy and native post-level data |
| Typefully (free plan) | Writing and scheduling, post analytics, CSV export, multi-account views | 4/5 | Free tier, paid upgrades | Creators, writers, indie makers | Clean composer plus analytics for native posts |
| SocialDog (free plan) | Scheduling, basic analytics with short lookback, follower management, AI helper | 3/5 | Free tier, paid upgrades | Solo creators, single-account managers | Practical scheduler with X support for beginners |
| Fedica (formerly Tweepsmap) free tier | Audience geo and follower analytics, growth tracking, keyword filters | 4/5 | Free tier, paid for maps and exports | Brands, researchers, audience analysts | Follower mapping and deeper audience profiling |
| Twitonomy (free with premium) | Visual tweet, mention, and hashtag analytics, follower reports, historical views | 4/5 | Free basic tier, premium exports | Analysts, power users, researchers | Twitter-focused visual timelines and account history |
| Tweet Binder (free report) | Hashtag and account 7-day reports, impressions and reach estimates, contributor ranks | 3/5 | Free limited report, paid upgrades | Event managers, campaign analysts | Free campaign snapshot for quick audits |
| FollowerAudit (free audit) | Fake and inactive follower detection, authenticity scoring, bot signals | 3/5 | Free limited audits, paid upgrades | Influencers, sponsorship managers | Quick follower-quality audit for sponsorship readiness |
| Livecounts.io Live Follower Counter | Real-time follower count, profile comparisons, embeddable widgets | 3/5 | Free | Creators, community managers, competitors | Immediate public follower monitoring and embeds |
| SuperX Free Profile Analytics | Profile analytics, top tweets, estimated earnings, health score, tools | 3/5 | Free tools with estimates | Competitor scouts, creators, marketers | Multi-tool no-login scans for quick competitive checks |
| Max Intel Bookmarklet Analyzer | Browser timeline scan, engagement rates, format and hashtag breakdown | 3/5 | Free | Privacy-conscious analysts, researchers | Runs locally as a bookmarklet without API limits or logins |
From Data to Growth: Your Next Steps
A good free analytics stack on X doesn’t need to be complicated. Start with native analytics for your own post truth. Add one workflow tool like Typefully or SocialDog if scheduling and review need to live together. Add one specialist tool only when you have a specific question, such as follower quality, hashtag performance, or public-profile pattern research.
Before you measure anything, decide what success means for your account. If you’re trying to grow audience awareness, track impressions, profile visits, and follower movement. If you’re trying to build conversation, watch replies, reposts, and engagement rate. If you want traffic or signups, focus on link clicks and which post formats create action rather than passive reach.
A simple weekly workflow works better than a giant monthly report you never finish:
- Pick five recent posts
- Label each one by format, topic, and intent
- Check which ones drove the strongest outcome
- Write down one thing to repeat and one thing to stop
- Turn that into next week’s posting plan
Here’s a concrete X example. If one short founder post gets strong profile clicks and another broad advice post gets likes but no profile interest, don’t just conclude that the second post “performed well.” It reached people, but it may not have moved the account forward. Better analytics habits come from matching the metric to the goal.
A sample review note might look like this:
Post A got attention. Post B got curiosity. Curiosity usually compounds better.
That’s the shift most creators need. Analytics isn’t there to decorate a dashboard. It’s there to help you write a better next post, join better conversations, and stop repeating formats that look good but don’t convert into growth.
If you want to make that loop more practical, mockups can help before you publish. You can test layouts, hooks, and campaign visuals with a free fake tweet generator or a free quote tweet generator. Those are useful for planning, presentations, internal reviews, and creative approvals. They should not be used to mislead people.
The best setup is simple: measure what matters, keep your review habit lightweight, and turn every insight into a concrete writing or posting decision. That’s how free Twitter analytics becomes a growth system instead of a pile of charts.
If you want to go beyond measuring and speed up your X workflow, try Xholic AI. It’s built for creators, founders, marketers, and power users who want to find high-momentum conversations, generate better replies, remix proven posts, organize research, track consistency, and keep publishing without living inside the feed all day.