Twitter impressions are the total number of times a tweet is shown to users on the platform, whether in their timeline, search results, or on a profile. Unlike reach, which counts unique viewers, impressions count every single view, even if it’s the same person seeing it multiple times.
If you’re staring at X analytics and wondering why one post got attention while another went unnoticed, impressions are usually the first number worth understanding. They aren’t a vanity metric. They’re the raw material for engagement, follower growth, replies, clicks, and every downstream result you care about.
Most founders and creators make the same mistake. They look at likes first. The better move is to look one layer up. If impressions are weak, your content never got enough shots on goal. If impressions are strong but engagement is weak, your hook, format, or audience match is off. That distinction saves a lot of wasted posting.
What Are Twitter Impressions and Why They Matter in 2026
Users often ask what are impressions on twitter when they notice a mismatch between effort and results. You write a strong post, it gets a few likes, and analytics shows a much bigger view count than expected. That number is telling you how often X served your content.
Twitter impressions represent the total number of times a tweet is displayed across the platform, and they are counted as non-unique views. If one person sees the same tweet several times, each appearance counts. That’s why impressions can climb well beyond your follower count.

The metric matters more now because distribution on X is more algorithmic than follower-based. According to Quintly’s breakdown of Twitter impressions and reach, X posts averaged 2,121 impressions in 2024, up 76% from 1,206 in 2023, and the average grew again to 2,711 impressions per post in 2025.
That trend matters for one reason. X is willing to push content beyond your own audience if the post shows the right signals early.
Why founders should care
If you’re using X for distribution, impressions are the top of the funnel. No impressions means no chances for replies, profile visits, or link clicks. More importantly, impressions tell you whether the platform is giving your content a real test.
A post with modest engagement but strong impressions often means the algorithm gave you a shot. A post with low impressions never really entered the game.
Practical rule: Check impressions before you judge the content. Low engagement on low impressions means the post wasn’t distributed. Low engagement on high impressions means the post was distributed and didn’t convert attention.
What this metric actually helps you diagnose
- Distribution strength: Is X putting your post in front of people at all?
- Topic resonance: Which subjects keep earning more screens over time?
- Format performance: Do your visuals, replies, threads, or short takes get served more often?
- Momentum potential: Which posts deserve a follow-up, remix, or second-angle version?
Decoding Twitter Impressions The Core Concept
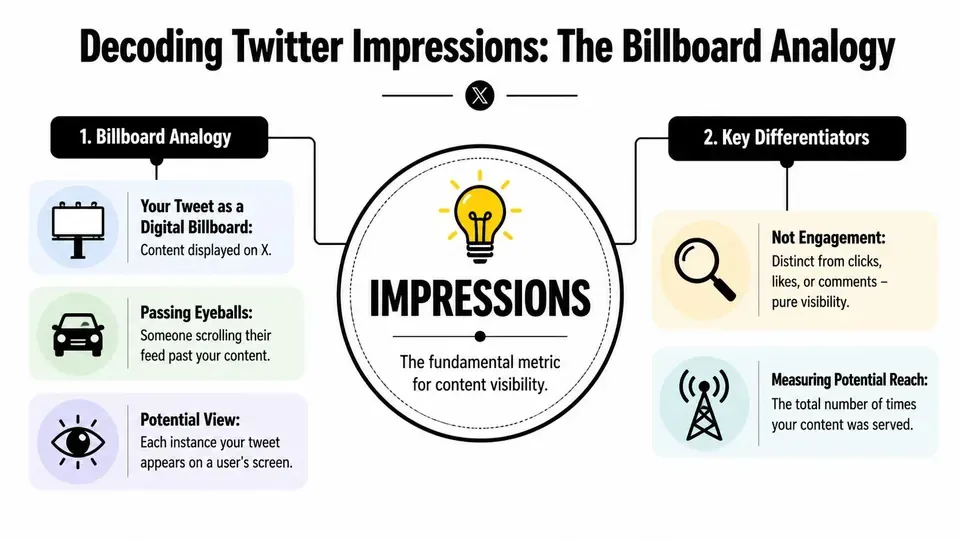
The cleanest way to understand impressions is the billboard analogy. Your tweet is the billboard. Every time it appears on someone’s screen, that’s a view. It doesn’t matter whether that person stops, reacts, or keeps scrolling. The appearance itself is the count.
That also means one person can create multiple impressions on the same tweet. If they see your post in their feed, then again on your profile, then again through a repost or quote, those are separate impressions.
What usually counts as an impression
In practice, impressions come from the places where X displays a tweet inside the platform. Common examples include:
- Timeline views: Someone scrolls past your post in Home or For You.
- Profile views: A user visits your profile and sees the tweet there.
- Search exposure: Your tweet appears in search results.
- Amplified surfaces: Reposts and quotes can create more places where the tweet is shown.
The key point is simple. Impressions measure visibility, not action.
What impressions are not
A lot of confusion starts when creators treat impressions as proof that people cared. They don’t prove that. They only prove the platform served the content.
They also aren’t the same as reach. Reach asks how many unique people saw the tweet. Impressions ask how many total times the tweet appeared.
A tweet with high impressions and weak response isn’t a success by default. It means X gave you distribution. You still have to earn the stop, the click, or the reply.
Why this matters for analysis
Once you understand the core concept, a lot of analytics becomes easier to read:
- A tweet can outperform your follower count because impressions are cumulative, not unique.
- A repost from the right account matters because each new audience creates more display opportunities.
- Repeated exposure has value because people often follow or click after seeing a name more than once.
That’s why experienced operators don’t dismiss impressions. They treat them as the first signal that the machine is working.
Impressions vs Reach vs Engagement A Crucial Distinction
These three metrics get mixed together constantly, and that leads to bad decisions. If you want to read X analytics like a grown-up, separate them fast.
A simple store analogy helps. Impressions are how many times people pass the window. Reach is how many different people passed the window. Engagement is who walked in, looked around, asked a question, or bought something.
On X, those differences matter because each metric answers a different question. Impressions tell you if content was shown. Reach tells you how broad the audience was. Engagement tells you if the content got a reaction.
Impressions vs Reach vs Engagement at a Glance
| Metric | What It Measures | Why It Matters for a Creator |
|---|---|---|
| Impressions | Total number of times a tweet was displayed | Shows whether X is distributing your content |
| Reach | Unique people who saw the tweet | Helps estimate audience breadth, though X doesn’t officially support organic reach as a native metric |
| Engagement | Actions taken on the tweet, such as likes, replies, reposts, clicks, and expands | Shows whether the content made people do something |
The mistake most people make
Beginners usually obsess over engagement and ignore distribution. That’s backwards. If a post has weak impressions, it never got enough exposure to produce meaningful engagement in the first place.
The opposite mistake is chasing impressions with low-quality posting. That creates activity without real audience movement. A post can get seen widely and still fail to earn trust, follows, or traffic.
How to use the three metrics together
Here’s the practical way to read them:
- High impressions, low engagement: Your hook or message didn’t convert visibility into action.
- Low impressions, decent engagement: The content may be strong, but it didn’t get enough distribution.
- High impressions, high engagement: That’s the combination worth studying and repeating.
- Moderate impressions, strong follower response: This often signals a niche fit. Don’t dismiss it.
If you’re trying to improve your posting mechanics, this breakdown pairs well with a more tactical playbook on how to go viral on Twitter in 2026.
Don’t ask whether a tweet was “good.” Ask three separate questions. Did people see it? Did the right people see it? Did any of them act?
That framing keeps you from overreacting to a single number.
How to Find Your Impressions and What to Look For
Finding impressions is easy. Interpreting them is where progress often stalls.
Check the number in two places
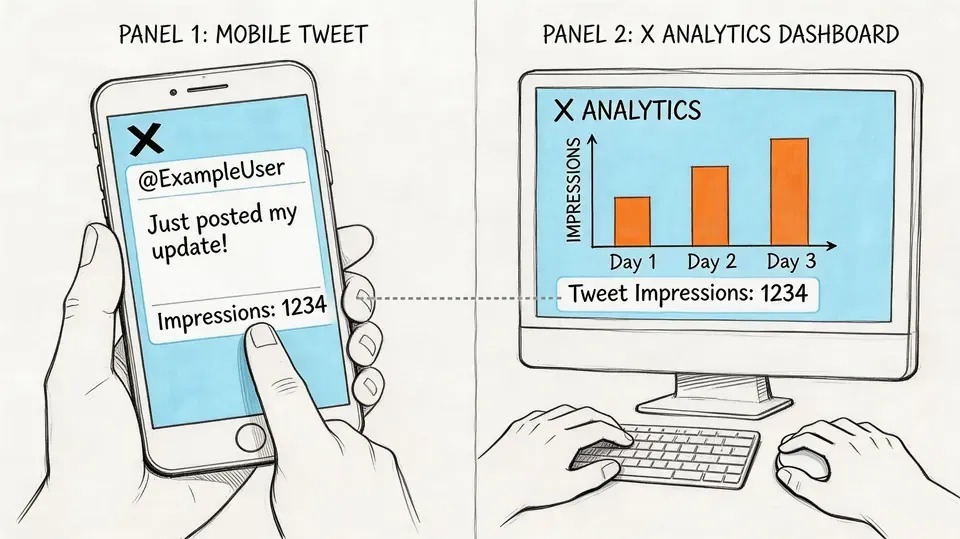
First, look at the individual tweet level. Open a post and check the view count tied to that specific tweet. This is the fastest way to judge whether a single idea got traction.
Second, use your broader analytics dashboard to compare posts against each other. That’s where patterns show up. You stop asking why one tweet flopped and start noticing that certain formats, topics, and post styles consistently get more distribution.
Two habits help here:
- Review by format: Compare text-only posts, image posts, threads, and reply-led posts separately.
- Review by topic: Put product updates, opinions, educational posts, and commentary in different buckets.
Interpret the number like an operator
A raw impression count isn’t useful on its own. Context matters. According to Brenton Way’s X marketing statistics roundup, the average organic impression rate typically sits between 0.5x and 2x follower count, while excellent content can reach 5x to 10x. The same source notes that tweets with images receive 150% more engagement and retweets than text-only posts.
That gives you a strong starting benchmark. If you have a thousand followers and most tweets stay well under that general band, distribution is likely weak. If a post breaks above it, study the structure before you move on.
A short walkthrough can help if you want to see the interface in motion:
What to look for in your data
Don’t just sort by top posts and call it analysis. Look for recurring signals:
- Visual lift: Do screenshots, charts, or clips consistently outperform text-only posts?
- Topic fit: Which subjects earn impressions without needing controversy?
- Time sensitivity: Are reactive posts getting faster distribution than evergreen ones?
- Reply impact: Do thoughtful replies generate profile visits that lift later posts?
If you track those patterns for a few weeks, you’ll have something better than generic posting advice. You’ll have your own operating model.
Strategies to Systematically Increase Your Impressions
You don’t increase impressions by posting more random thoughts. You increase them by giving the algorithm stronger reasons to test your content, then making that test convert into more distribution.
The mechanics matter. Sprout Social’s guide to Twitter impressions notes that engagement rate is calculated as (Engagements / Impressions) x 100, and that impressions often start through the For You timeline. The same source says early visibility from 1% to 2% of follower views can seed virality, a tweet that hits 500 impressions in the first hour can cascade to 10,000+, and joining high-momentum conversations can triple impression spikes.
Optimize for early distribution
X doesn’t need universal approval to keep pushing a post. It needs enough early evidence that the post deserves more screens.
That means your opening line matters more than your closing line. Strong early distribution usually comes from content that gives a clear reason to stop:
- Specific hooks: A clear claim beats a vague observation.
- Fast readability: Short paragraphs, sharp phrasing, and clean formatting help.
- Immediate relevance: Posts tied to an active conversation often get tested faster.
If a post gets initial exposure and people react, quote, or repost, the impression curve can change quickly.
Use formats that earn more screens
Some formats are easier to distribute because they create stronger stop signals in-feed.
A few examples that often work better than plain text dumps:
-
Image-backed takes A screenshot, chart, or visual proof point can slow the scroll and create more dwell time.
-
Replies on live discussions A smart reply under a high-visibility post can generate profile visits and second-order impressions for your later posts.
-
Structured threads Threads aren’t magic, but when the first post earns attention, the rest can keep people engaged longer.
If your text-only posts keep stalling, don’t just rewrite the text. Change the package.
For practical examples of stronger post formats, study working patterns in this guide to boosting Twitter engagement with AI writing and post tools.
Build around momentum not guesswork
A lot of creators still post in isolation. They publish a stand-alone thought, hope the algorithm likes it, then move on. That’s inefficient.
A better system is to publish into existing momentum. That means:
- Join a topic while it’s active
- Add a point of view, not a generic reaction
- Follow up when a post gets traction
- Remix structures that already earned distribution on your account
This isn’t about copying. It’s about recognizing that X rewards context, timing, and relevance. Strong creators manufacture impressions by placing good ideas where attention already exists.
What usually doesn’t work
Just as important, some habits suppress impressions even when the idea is decent:
- Posting without a hook: The post may be smart, but nobody stops.
- Overstuffed takes: Dense walls of text lose mobile readers.
- Cold outbound posting only: If you never reply, quote, or participate, you rely entirely on your own baseline distribution.
- Ignoring your own winners: If a structure worked once, test variations instead of starting from zero every day.
The goal isn’t a single viral hit. It’s a repeatable process that gets your content more tests, more screens, and more chances to compound.
Beyond Raw Numbers Quality Impressions for Real Growth
A high impression count looks good in analytics. It doesn’t always help the business.
The advanced view is this: not all impressions are equal. If your post is shown widely to people who will never care about your niche, the number inflates while the account stays flat. That’s why experienced operators care about quality impressions, not just volume.
Why some impressions are worth more than others
According to Sociality’s analysis of Twitter impressions, X’s Q1 2026 transparency report showed that impressions from Grok-curated For You feeds surged 340% YoY for non-follower accounts, yet only 12% converted to engagement without semantic relevance. The same source notes that top creators saw 5x follower gains by focusing on reply-chain impressions, which were amplified 2.7x after the 2025 updates.
That tells you something important. Distribution to strangers is useful only when the content matches what they care about.
What quality impressions look like in practice
Good impressions usually have one or more of these traits:
- Topical alignment: The viewer already cares about the problem you talk about.
- Contextual placement: Your post appears inside a conversation they were already following.
- Identity fit: The account looks credible when they click through.
- Follow-up potential: The impression leads to a reply, profile visit, or eventual follow.
This is why reply chains can outperform isolated broadcast posts. They place your thinking inside a relevant stream of attention.
If you want to sharpen that side of the skillset, study real post patterns in these examples of tweets that actually work in 2026.
Chasing every possible impression can grow a graph and shrink signal quality at the same time.
A smaller pool of relevant impressions often does more for follower growth than a broad burst of untargeted exposure.
Frequently Asked Questions About Twitter Impressions
1. Do my own views count toward impressions?
X defines impressions as the number of times a tweet is displayed on the platform. If your own account displays the tweet, that appearance can count as an impression. The practical takeaway is not to obsess over that detail. Your own views won’t be the main driver of the metric.
2. Do protected or private tweets generate impressions?
They can generate impressions within the limited audience allowed to see them. But they won’t behave like public tweets because distribution is constrained by who has access. If you’re trying to learn how the algorithm distributes content, protected posting won’t give you a clean read.
3. Do embedded tweets on other websites count in X analytics?
The verified guidance here is to be careful. The available data notes that impressions exclude logged-out and third-party views in some contexts, so embedded visibility outside the core in-app experience may not fully appear in your impression totals. For practical reporting, treat on-platform analytics as your primary source of truth and use other tracking methods for off-platform outcomes.
If you’re serious about turning impressions into consistent growth, Xholic AI helps you find high-momentum conversations, write sharper replies, and publish on-brand content faster. It’s built for founders, creators, analysts, and solo operators who want more reach without spending more hours in the feed.