
You can’t access another account’s private, native X Analytics dashboard. What you can do is analyze a public account with visible post activity and third-party tools, then turn those signals into a practical view of what’s working in their content strategy.
That is usually the primary need behind searches for twitter analytics for another account. You see a founder in your niche getting strong engagement, a creator landing replies on every post, or a brand posting with unusual consistency, and you want to know whether there is something worth learning from. The useful answer isn’t “no, you can’t see their dashboard.” It’s “yes, you can benchmark them legally and ethically, if you know which signals are reliable and which ones are just noise.”
Understanding What’s Possible with Competitor Analytics on X
Most confusion starts with one false assumption. People think competitor research on X means opening up someone else’s analytics dashboard. That isn’t how it works.
Native X/Twitter Analytics is built for the account owner, not for public competitor research, and the standard view is framed as a 28-day summary of metrics like impressions and follower growth according to SocialDog’s explanation of X analytics limits. If you want another account’s native data, you’d need access to that account or data shared by the owner.

That limitation matters because it changes the question. Instead of asking, “Can I see their impressions?” ask, “What can I infer from their public behavior?”
Three ways to analyze another account
There are three practical methods.
-
Manual observation
This is the free method. You review posts, replies, pinned tweets, timing, and visible engagement patterns yourself. -
Third-party analytics tools
These tools turn public data into structured reports. They help you compare accounts, spot trends, and estimate performance. -
The X API
This is for teams or technical users who want their own dashboards, alerts, or niche-specific monitoring workflow.
If you already use your own Twitter analytics dashboard, think of competitor analysis as a separate layer. Your native dashboard tells you what happened on your account. Public account analysis helps you figure out what patterns might be worth testing on yours.
Practical rule: Treat competitor analytics as inference, not direct access.
That mindset keeps your conclusions sharp. You can identify posting frequency, recurring topics, reply behavior, visible engagement, and audience signals surfaced by tools. You can’t see private impressions, private conversions, or the exact internal metrics that drove a post’s reach.
Manual Observation Techniques: The Free Method
You can learn a lot before paying for anything. In many client audits, the manual review is where the strongest strategic clues show up first.
Start with a public account and look at it like an operator, not a fan. Don’t ask whether their posts look good. Ask what repeated behaviors seem to drive attention.
Audit the profile before you audit the posts
A public X profile tells you a lot about positioning.
- Read the bio carefully. It usually reveals the audience they want, the niche they occupy, and the tone they’ve chosen.
- Study the pinned post. This often acts as their conversion layer. It can show whether they prioritize authority, product awareness, newsletter signups, or community building.
- Check the link in bio. Even without private analytics, the destination often tells you what business outcome their X presence supports.
- Look at the display name and header. These are often aligned with their primary content angle or offer.
For a deeper refresher on first-party metrics versus public benchmarking, this guide on Twitter analytics is a useful companion.
Map their content pillars
Once the profile is clear, scan recent posts and group them by theme.
A simple manual framework:
- Educational posts that teach a tactic, workflow, or lesson
- Opinion posts that stake out a clear point of view
- Personal posts that build familiarity or trust
- Promotional posts tied to products, services, or launches
- Reply-led visibility plays where the account grows by showing up in other people’s threads
You’re looking for repetition. If someone gets steady traction from short opinion posts and almost none from long threads, that’s useful. If their personal stories get replies but their promotional posts don’t, that’s useful too.
The point of manual observation isn’t to prove causation. It’s to find patterns worth testing.
Check posting rhythm and reply behavior
A lot of people stop at likes and reposts. That misses the mechanics.
Review:
- Posting cadence. Are they posting in bursts or consistently?
- Format choice. Mostly single tweets, threads, quote posts, media posts, or questions?
- Reply activity. Do they reply early to comments on their own posts? Do they spend time replying to larger accounts?
- Conversation style. Are their replies thoughtful, provocative, educational, or just short acknowledgments?
One practical way to do this is to review a recent batch of posts and note what happened around them.
| Signal | What to look for | What it may suggest |
|---|---|---|
| Pinned tweet | Offer, belief, or lead magnet | Core conversion goal |
| Posting frequency | Consistent or irregular publishing | Operational discipline |
| Topic repetition | Same themes appearing often | Clear content pillars |
| Reply depth | Short replies or substantial responses | Community strategy |
| Audience response | Quality of comments and quote posts | Relevance to niche |
A simple manual benchmark sheet
Use a basic checklist for each competitor:
- Primary audience
- Main topics
- Most common post format
- Typical reply style
- Strongest visible posts
- Weakest visible posts
- Clear calls to action
- Signals worth borrowing
- Signals to ignore
Here’s a concrete X example. Suppose a founder account keeps posting short takes like:
“Most startup content fails because it reports activity instead of teaching decisions.”
If that account also spends time replying to other founders with specific product or growth observations, the likely lesson isn’t “post hot takes.” It’s “combine clear positioning with high-context replies.”
That’s a much better takeaway than copying the wording.
Using Third-Party Tools for Deeper Insights
Manual reviews are useful, but they don’t scale well. Once you want to compare several accounts, monitor changes over time, or inspect audience patterns, you need software.
Third-party tools have expanded competitor analysis from simple follower checks into deeper audience and content intelligence, including follower evolution, demographic analysis, engagement scoring, and content benchmarking, as described in Fedica’s overview of Twitter analytics for another account.
That shift changes what “analytics for another account” means in practice. You’re no longer just checking who has more followers. You’re comparing how accounts publish, who appears to engage with them, and what topics or formats keep resurfacing.
What these tools can actually help you see
Different products emphasize different layers of analysis, but the useful outputs tend to fall into a few categories:
-
Follower evolution
Helpful when you want to see whether an account appears to grow steadily, in spikes, or after specific content runs. -
Engagement patterning
Useful for identifying whether an account’s strongest performance comes from certain formats, themes, or conversation styles. -
Audience composition and overlap
Some tools try to surface demographics, follower segmentation, overlap, or audience quality signals. -
Search-based post analysis
Tools can also look at mentions or account-specific queries such as tweets mentioning a handle or tweets sent from a handle. -
Peer-set comparison
This matters more than raw account review. Comparing one public profile against a niche set usually reveals more than looking at it alone.
If you want a broader range of options, this roundup of free Twitter analytics tools can help you sort options by workflow.
Choosing a tool by job, not by feature list
The wrong way to buy analytics software is to chase the most crowded dashboard. The right way is to match the tool to the question.
Use this filter:
| Your goal | Tool capability that matters most |
|---|---|
| Benchmark competitors | Multi-account comparison |
| Understand audience makeup | Demographic or segmentation views |
| Track content style | Post-level engagement and topic patterns |
| Monitor conversation share | Mention and handle query analysis |
| Find what’s heating up now | Momentum or trend discovery |
One useful category here is discovery-first tools. Instead of only telling you how a known account has been performing, they help you spot high-momentum tweets and conversations in your niche while those topics are still moving. That’s different from classic competitor dashboards.
For example, Xholic AI is an AI-powered X growth toolkit that can help users discover rising tweets, organize research, generate replies, remix posts, and schedule content. In a competitor-analysis workflow, that matters when you want to study what themes and hooks are gaining traction around specific creators or market conversations, not just inspect a static profile after the fact.
What works and what doesn’t
Tools work well when you use them to answer questions like:
- Which topics keep generating visible engagement across a peer set?
- Which accounts rely on replies versus original posts?
- Which formats appear repeatedly among top-performing posts?
- Which audience clusters overlap across competing creators?
Tools don’t work well when you expect them to reveal private truth. They can’t tell you exact internal impressions for another account, exact conversions, or whether a post succeeded because of distribution, timing, brand strength, or off-platform demand.
Good competitor analytics software improves your odds of seeing patterns. It doesn’t remove the need for judgment.
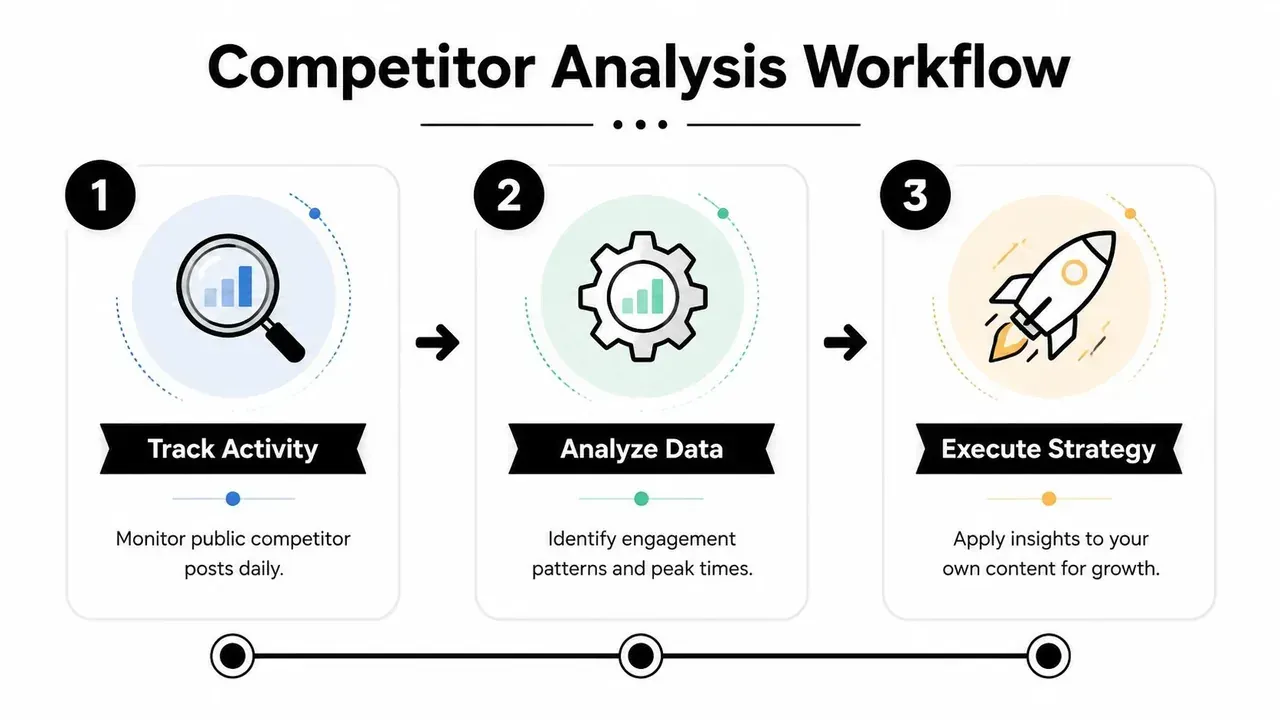
A Practical Workflow for Competitor Analysis
Marketing professionals rarely need more dashboards. They need a repeatable way to turn public account data into content decisions.
A reliable workflow for analyzing another account starts by confirming the profile is public, collecting a baseline from visible posts, using a third-party tool for engagement and follower-pattern research, and then comparing results against a peer set, as outlined in Tweet Binder’s workflow for competitor account analysis.
Step 1 Pick a real peer set
Don’t compare yourself to celebrity accounts or giant media brands unless they operate in your lane and at your stage. Pick a tight set of public accounts that compete for similar attention.
A useful peer set often includes:
- A direct competitor with a similar offer or audience
- An aspirational peer that executes content more consistently
- A format specialist who’s especially strong at threads, replies, visuals, or hooks
This makes your benchmarking more practical. You’re not trying to copy the biggest account. You’re trying to understand the patterns in your market.
Step 2 Build the baseline manually
Before opening a tool, write down what you can observe.
Use a short worksheet:
- Their top recurring topics
- Their common opening hooks
- Whether they post mostly original tweets, quote posts, or replies
- How often they ask questions
- Whether their comments look broad or niche-specific
- Which posts feel native to X versus repurposed from somewhere else
Software can show trend lines, but it won’t automatically tell you why one account sounds sharper than another.
Step 3 Pull public-account data with tools
After the baseline, run the tool layer. Look for:
- engagement patterns
- follower evolution
- notable post formats
- audience overlap or demographic clues if available
- relative strength versus the peer set
Don’t force a verdict from one report. Compare signals.
Here’s the best question to ask at this stage:
Which public signals repeat often enough that I’d trust them as a content clue?
Step 4 Turn observations into decisions
Many users stop too early. They collect notes and never convert them into publishing changes.
Use a decision table like this:
| Observation | Likely interpretation | Action for your account |
|---|---|---|
| Competitor gets strong discussion on opinion posts | Audience responds to point of view | Test sharper stance-based posts |
| Replies drive visibility | They use conversation as distribution | Build a daily reply habit |
| Educational posts outperform promotions | Value-first content earns trust | Move promotions after useful posts |
| Topic cluster appears repeatedly | Market interest is stable | Add that theme to your calendar |
Example of a mini competitor audit
Suppose you’re a SaaS founder tracking another founder account in your space.
You notice:
- Their best visible posts are short, direct lessons from recent product decisions.
- They reply quickly to comments from other founders and operators.
- Their promotional posts are sparse, but when they do promote, they tie the product to a clear pain point.
- Their content themes repeat. Build in public, user feedback, pricing decisions, and mistakes.
A weak takeaway would be: “Post more founder content.”
A better takeaway would be:
- publish more decision-based posts instead of generic advice
- turn product updates into lessons
- reply to adjacent founder conversations the same day
- keep promotional posts specific and tied to context
If you want to execute that without living in the feed all day, browser-based workflows help. The Xholic AI Chrome extension guide shows one way to save posts, study patterns, and respond while you’re already on X.
A weekly operating rhythm
Use a simple routine:
- Monday. Review public posts from your peer set.
- Midweek. Check tool outputs for movement and notable content.
- Friday. Write down what changed in your own plan.
That final step is where analysis becomes growth. If the workflow doesn’t change what you publish, it’s just spectatorship.
Leveraging the X API for Custom Analytics
If you’re technical, or you have a developer on the team, the X API gives you a different kind of advantage. You can build a private workflow around public account monitoring instead of relying only on third-party dashboards.

The value here is control. You decide which accounts to monitor, which fields matter, how often to refresh, and how the output appears.
What custom analytics can do well
A custom setup is useful when your questions are very specific.
Examples:
- monitor a small list of competitors and log posting frequency
- track whether certain keywords or themes keep appearing in their recent posts
- compare how often they publish original posts versus replies
- build internal alerts when monitored accounts start discussing a topic relevant to your product
This isn’t the same as gaining access to private analytics. It’s structured public-data observation with your own logic on top.
The trade-offs
The API route has real upside, but it also has operational cost.
You’ll need to think about:
- Authentication. Public data access still requires the proper app setup and authorization flow.
- Rate limits. If your script pulls too much too often, you’ll run into limits.
- Data storage. Once you’re collecting timelines or account snapshots, you need a clean way to store and compare them.
- Maintenance. APIs change, internal dashboards break, and edge cases appear.
That’s why the API makes the most sense when off-the-shelf tools don’t fit your exact workflow.
Build custom analytics when the question is specific enough that a generic dashboard gets in your way.
A lightweight internal dashboard can be enough. You don’t need a massive system. Even a simple account monitor that logs post cadence, topic tags, and visible engagement over time can support editorial planning.
For a visual walkthrough of how people approach analytics tooling and setup, this video gives helpful context:
When to choose API over a tool
Choose the API if:
- you want account monitoring tied to your own internal process
- you need custom alerts or niche-specific tagging
- you care more about workflow fit than a polished dashboard
Choose a third-party tool if:
- you need speed
- you want audience or benchmarking layers already packaged
- you don’t want to maintain infrastructure
For most creators and marketers, tools are enough. For indie hackers, research-heavy teams, and analysts, API-driven monitoring can become a real edge.
Common Mistakes and Ethical Considerations
The biggest mistake in twitter analytics for another account is treating visible signals like certainty. Public data can guide decisions, but it can also tempt you into overconfident conclusions.
A common trap is overvaluing follower counts. As noted in Microposter’s discussion of public-data interpretation, many creators focus on easily gamed vanity metrics, while more actionable proxies include engagement rate, posting frequency, and topic clusters.
Mistakes that distort your analysis
Some errors show up repeatedly:
- Obsessing over follower size. Large audiences can hide weak content fit.
- Ignoring context. A post may perform well because of timing, an existing audience relationship, or a conversation already in motion.
- Copying formats without the underlying strategy. A thread structure or hook style doesn’t work the same way for every account.
- Reviewing snapshots instead of patterns. One visible hit can distract you from the account’s broader rhythm.
Ethical lines that matter
Competitor analysis should stay on the right side of both platform rules and common sense.
Use public information. Respect privacy. Don’t try to bypass account controls, scrape in abusive ways, or use competitor research for spam, harassment, or impersonation.
If you use mockup tools for planning content, campaign reviews, or product presentations, keep the use case honest. Mockups should support education, internal approvals, and design examples. They shouldn’t be used to mislead people.
Ethical competitor analysis helps you learn from the market. It doesn’t justify pretending to have data you never had.
The useful mindset is simple. Benchmark publicly. Infer carefully. Test on your own account.
FAQ About X Competitor Analytics
Can you see another person’s X analytics?
You can’t see another account’s private, native X analytics dashboard unless the owner gives you access or shares exported data. For public competitor research, use visible account activity and third-party tools.
What can I reliably learn from a public X account?
You can usually assess content themes, posting frequency, visible engagement patterns, reply habits, profile positioning, and whether certain topics or formats show up repeatedly. Those are useful proxies, not private internal metrics.
What’s the best free way to analyze a competitor on X?
Start manually. Review their profile, pinned post, recent posts, replies, and recurring themes. Build a simple comparison sheet across a few accounts instead of judging one profile in isolation.
Are third-party X analytics tools accurate?
They’re useful for benchmarking and estimation, especially across public accounts. They’re less reliable if you expect exact private metrics or definitive proof of why a post performed well.
Should I benchmark one competitor or several?
Several. A peer set gives you context. One account can reflect unusual audience loyalty, a temporary trend, or a niche-specific edge that won’t generalize.
Which signals matter most for content strategy?
The most useful ones are usually engagement quality, posting frequency, topic repetition, reply behavior, and format patterns. Those signals are much better for deciding what to test next than vanity metrics alone.
How often should I run competitor analysis?
A light weekly review works well for most creators and marketers. The key is consistency. You want to notice repeating patterns, not just react to a single strong post.
Turn Competitor Insights into Your Growth Playbook
The right way to use twitter analytics for another account is to treat it as a learning system, not a copying exercise. You’re looking for repeatable patterns in topics, formats, replies, and cadence that you can adapt to your own voice and audience.
That’s how competitor research becomes useful. You stop asking, “How do I replicate their post?” and start asking, “What does this reveal about what my market pays attention to?” That shift leads to better content decisions, better timing, and a more deliberate growth strategy.
If you want help turning those observations into action, try Xholic AI. It’s built to help you discover high-momentum X conversations, generate context-aware replies, remix proven formats into original posts, organize research, and stay consistent with scheduling and execution.